

The Wrong Map
Stray Narratives, Issue 03
Every oil shock in living memory has sent economists sprinting back to their 1973 textbooks, which is roughly as useful as a doctor diagnosing every fever as bubonic plague on the grounds that it was the last epidemic they studied in any depth. This time the ritual has been performed with particular speed. Within two weeks of the first strikes, the word stagflation had colonised research notes with the efficiency of a highly contagious and largely harmless virus — nobody is quite sure who released it first, everyone has it now, and the principal symptom is a high conviction that the Federal Reserve cannot cut rates until some time after the next ice age. For what it is worth, predicting the behaviour of a new Supreme Leader who has just lost his entire immediate family to airstrikes sits somewhere between reading entrails and consulting a Magic 8-Ball, except the Magic 8-Ball has a cleaner track record on crude oil.
So let me be straightforward about what this piece is and is not. It is not a forecast of how the Gulf conflict resolves — nobody knows that, and anyone who writes with high conviction about it is selling something. What it is, instead, is an examination of what is being priced into rates markets, a case for why that pricing looks wrong across most of the scenarios that actually matter, and a set of trade structures deliberately designed not to require us to be right about which scenario prevails. Humility about the geopolitical outcome is not a weakness of the thesis. It is, as I shall try to show, built into its structure.
Stagflation is not yet the consensus. It is being gradually priced. That is precisely the moment to ask whether the pricing is coherent.
What the market has decided
The rates market has made a clear and high-conviction call. Fed cuts have been priced out through year end. Other developed market central banks — Australia, Canada, and the euro area — have swung sharply toward pricing hikes. The analytical framework being applied is 1973: an oil shock arrives, inflation re-accelerates, the central bank stays on hold regardless of what happens to growth. Prices remain elevated, growth suffers, and the economy grinds through a stagflationary episode long enough to keep monetary policy pinned well into next year.
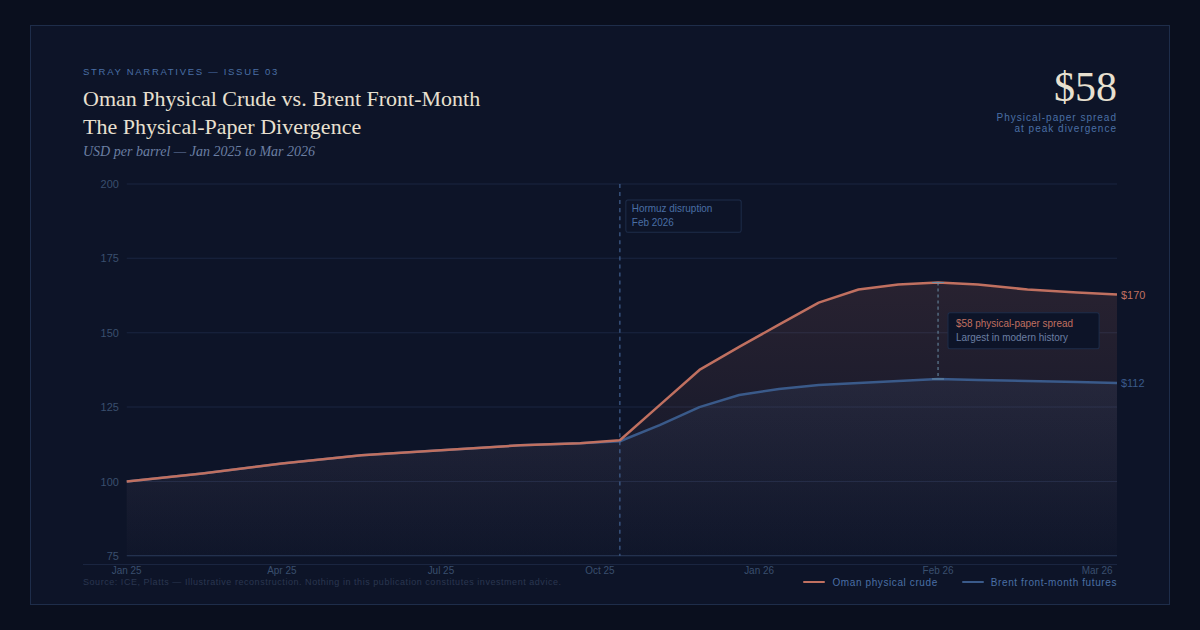
It is a coherent framework. It is being applied to the wrong situation. Not because the oil shock is not real — it is, and the physical evidence is striking: physical Oman crude has been trading near $170 per barrel against Brent futures closer to $112, the largest physical-paper divergence in the modern history of the oil market. The paper market is being held below physical reality by mechanisms — coordinated strategic reserve releases, Iranian floating storage disposals, the political expectation of a fast resolution — that are finite and time-bounded. This is not a market that has the situation priced in. It is a market that is being temporarily insulated from it.
But the deeper problem with the 1973 framework is structural, not tactical. The nature of the disruption is categorically different from anything that framework was designed to analyse — and it is not one disruption. It is two.
Two shocks, not one
The Hormuz disruption and the damage to the Ras Laffan LNG export complex are categorically different shocks with different durations, different transmission mechanisms, and different geographic incidence. Conflating them is the analytical error from which most of the current mispricing follows.
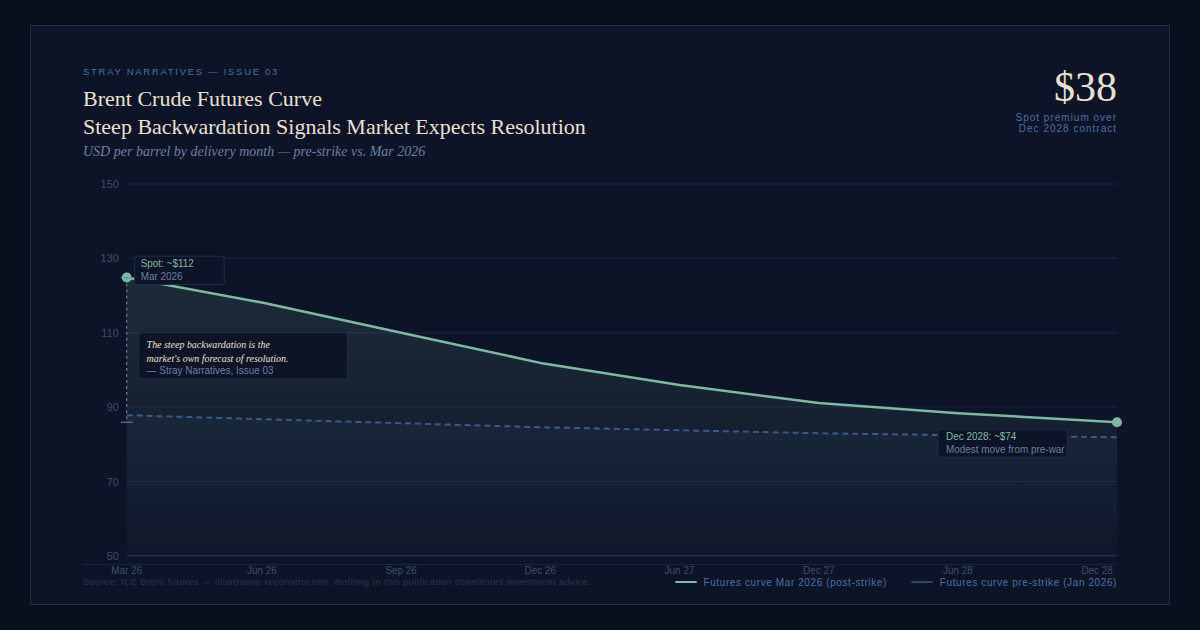
Hormuz is binary and reversible. Naval superiority, once asserted, resolves it. The futures curve already reflects this expectation: spot prices are sharply elevated, but contracts for late 2028 delivery have moved only modestly from pre-war levels. The steep backwardation is the market’s own forecast of resolution.
The LNG damage is structurally different in every relevant respect. Strikes on the Ras Laffan export complex have taken offline a material share of Qatari LNG capacity. Force majeure has been declared. The physical infrastructure carries a repair horizon of three to five years. This is not a disruption that resolves when a negotiation concludes. It is a constraint on the physical stock of export infrastructure that cannot be strategically released.
The geographic incidence is sharply asymmetric. Europe and Asia — most dependent on Qatari supplies, least able to substitute — absorb the structural, multi-year component almost entirely. The United States, as a net energy exporter, sits on the other side of that equation. Sustained LNG prices are a revenue stream for the US Gulf Coast, not a tax on it. This is the point the 1973 analogy misses entirely: that shock was broadly symmetric across oil-importing economies. The durable component of this one is a European and Asian problem. It is not the Federal Reserve’s problem.
The switch, not the dial
The 1973 Arab oil embargo was a managed and politically calibrated supply reduction. In every prior oil shock, Gulf spare capacity — historically concentrated in Saudi Arabia, the UAE, and Kuwait — served as the market’s primary shock absorber. That mechanism has been neutralised. Virtually all Gulf spare capacity sits on the wrong side of the strait and is physically inaccessible. The traditional buffer between a supply disruption and a full market impact no longer exists.
The actual distribution of outcomes is heavily bimodal. In the first tail, the strait reopens. Oil falls sharply. Inflation expectations collapse. The OIS strip reprices aggressively toward cuts. In the second tail, the conflict grinds on, Gulf infrastructure absorbs lasting damage, and the shock crosses the threshold at which it stops being inflationary and becomes outright recessionary. History is unambiguous here: every time oil prices have doubled year-on-year, the result has been a recession without exception. A shock of that magnitude does not produce stagflation. It destroys the demand that stagflation requires. The Federal Reserve cuts regardless of where headline CPI is printing.
Both tails produce cuts. The market is priced for the narrow corridor between them.
Why the 1970s transmission mechanism is no longer available
Three structural features made the 1973 shock stagflationary in a durable sense, and their absence in 2026 is not incidental. It is the argument.
The first and most consequential is labour market architecture. The 1973 shock arrived into an economy where organised labour retained genuine bargaining power. That channel is closed in 2026. Before the first strike, the US labour market was already decelerating materially. Private payroll creation, once annual revisions were applied, had slowed to roughly 15,000 per month excluding government roles and the acyclical health and education sectors. Job openings had been falling steadily for over a year. The ratio of openings to unemployed workers had crossed below one. The oil shock did not create a weak labour market. It arrived into one.
The second structural feature is fiscal capacity. The 1970s shocks arrived into economies that still had room to protect demand. That option is now largely closed. There is no fiscal space for another round of pandemic-scale support, and the midterm political dynamics make stimulus actively less likely with each passing week of an unpopular war.
The third is structural and novel. AI’s presence in this analysis is not the dramatic one — mass unemployment, wages collapsing overnight. The more immediately relevant observation is narrower: the expectation that AI will compress the value of cognitive labour is already suppressing wage expectations and bargaining behaviour in ways that are measurable today. Real income expectations have been declining across every earnings bracket for over a year, with the deterioration sharpest among the upper-income cohort most exposed to AI displacement risk. The wage-price spiral that made 1973 compound has no ignition source.
The K-economy and the oil tax
Household equity wealth reached roughly double annual disposable income — a ratio without precedent in post-war data — keeping aggregate spending well above what wage growth alone could sustain, while the savings rate was drawn down to historically low levels across the income spectrum. An oil shock of this magnitude hits both mechanisms simultaneously. Equity prices fall as growth fears compound. The bottom 90% absorb a direct energy tax on a savings rate with no remaining cushion.
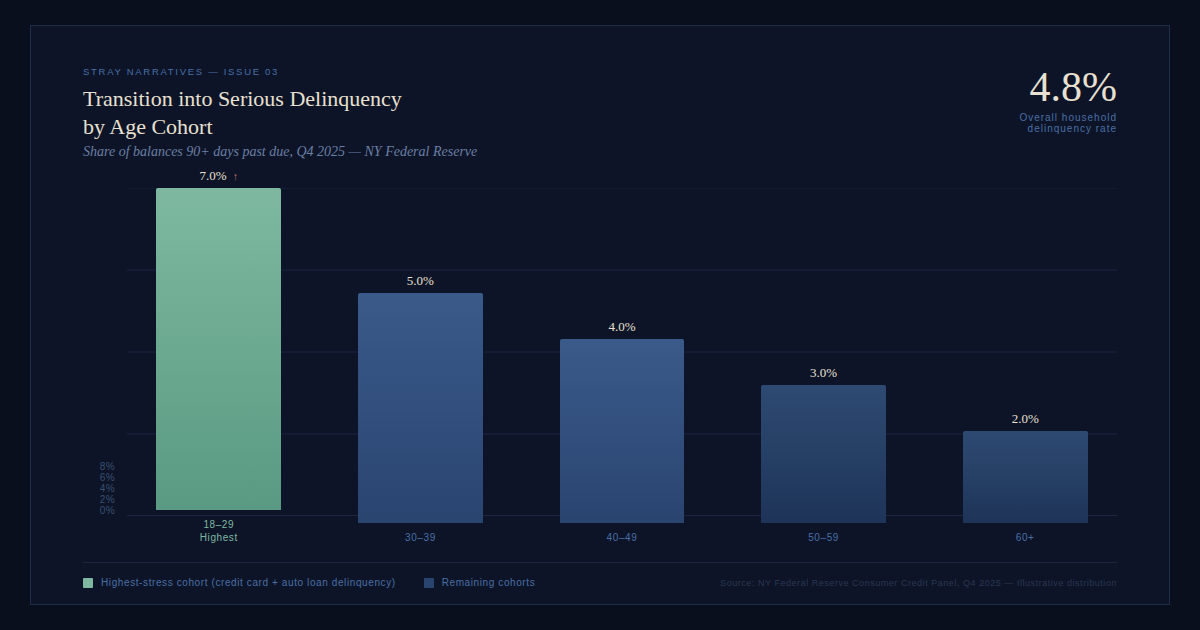
The consumer credit data is no longer ambiguous on the underlying condition of that consumer. NY Fed household delinquency rates have reached 4.8% and are moving in the wrong direction. Youth unemployment is running between 9.5 and 10.5%. The under-29 cohort is showing the highest transition rates into serious delinquency on credit cards and auto loans of any demographic group tracked. The pattern carries a structural resemblance to the late 1990s technology cycle — then, the physical labour demands of a continental fibre build-out absorbed displaced workers and papered over the sectoral divergence long enough to sustain the headline numbers. No equivalent programme exists today.
When the fracture comes, it will not announce itself through headline unemployment. The transmission runs through the private credit complex — the opaque, floating-rate structures most heavily exposed to lower-tier borrowers, carrying the least transparency into deteriorating loan performance. When that complex cracks, it does not stay contained. High yield follows. The sequence forces the Federal Reserve’s hand regardless of where headline CPI is printing. This is a demand destruction dynamic wearing stagflation’s clothing.
The trades
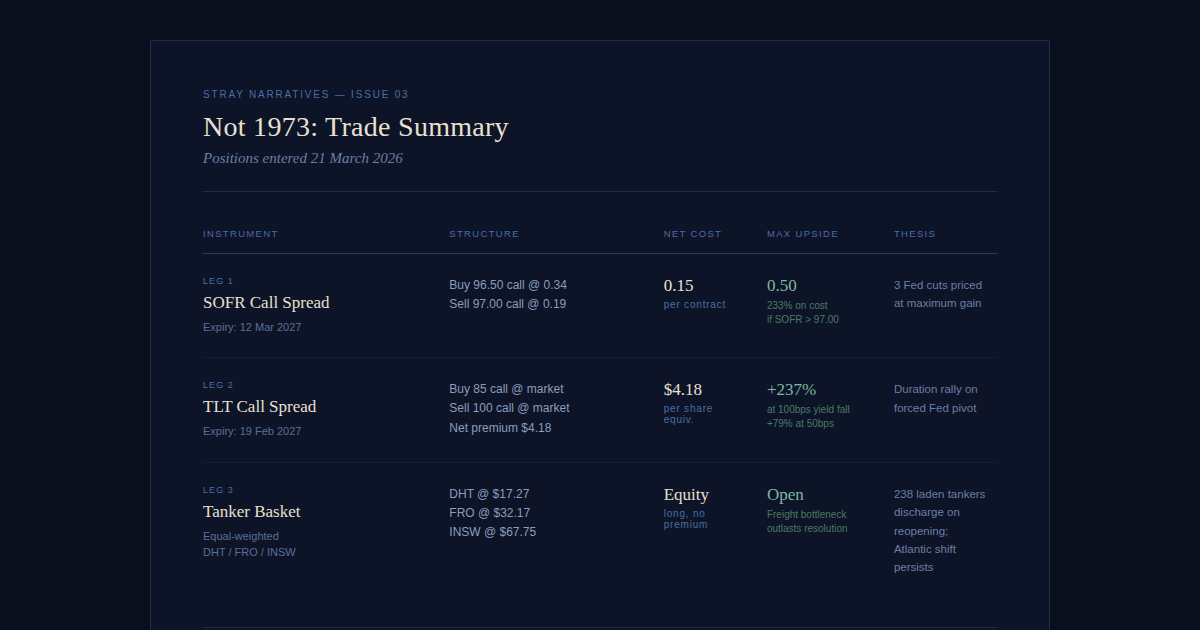
The first leg is through a SOFR call spread expiring 12 March 2027. We buy the 96.50 strike at 0.34 cents and sell the 97.00 strike at 0.19 cents, for a net cost of 0.15 cents. The maximum payout of 0.50 cents is realised if SOFR settles above 97.00 at expiry — equivalent to three additional Fed cuts from current levels. The structure costs less than a third of its maximum payout, and requires no view on sequencing or timing beyond the destination.
The second leg is through options on long duration. We buy the TLT 85 strike and sell the 100 strike, both expiring 19 February 2027, at a net premium of $4.18. A 50 basis point fall in long yields takes TLT to roughly $92.50, returning approximately 79% on premium. A 100 basis point move takes TLT to roughly $99, returning approximately 237%.
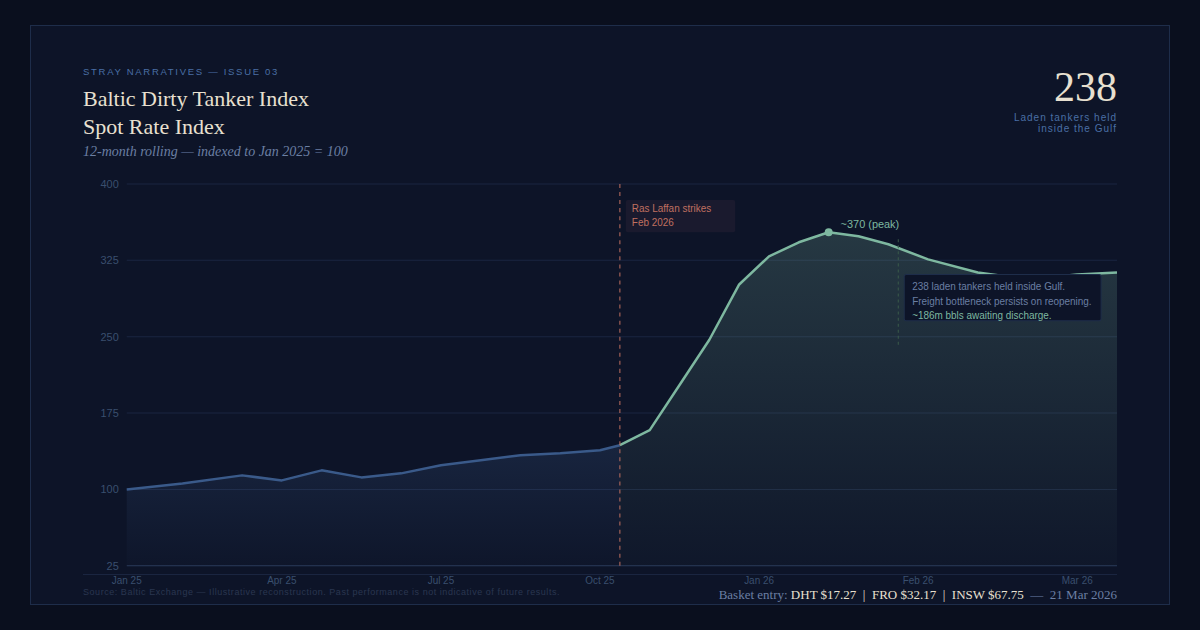
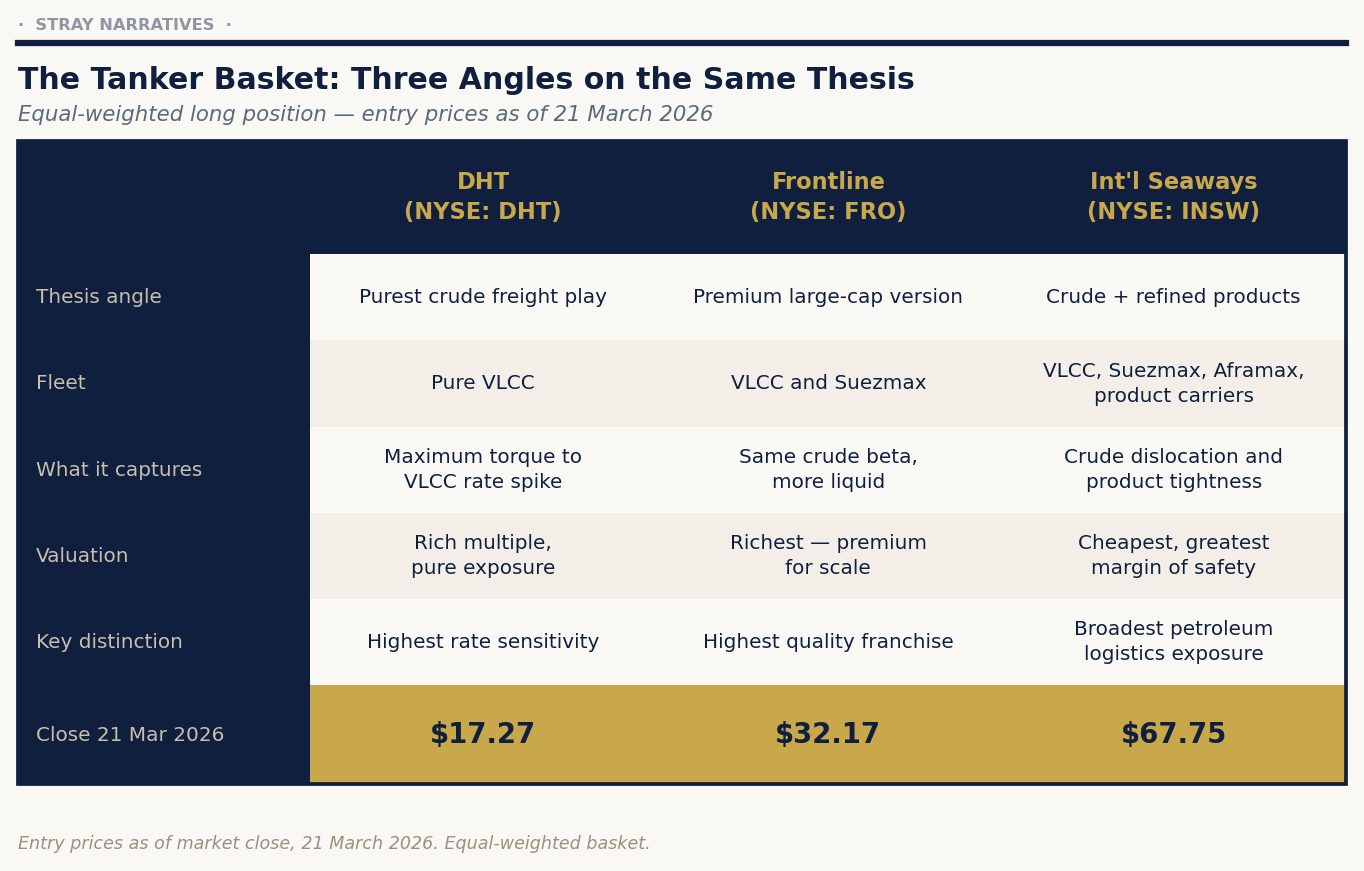
The third leg operates on a separate and complementary logic. When the strait eventually reopens, an estimated 238 laden crude tankers currently holding roughly 186 million barrels inside the Gulf must discharge into destination ports simultaneously. The logistical bottleneck sustains elevated freight rates for months after the political resolution. Meanwhile the structural shift toward Atlantic Basin loading will not fully reverse. We express this through an equal-weighted basket of DHT (NYSE: DHT), Frontline (NYSE: FRO), and International Seaways (NYSE: INSW), entered at closing prices of $17.27, $32.17, and $67.75 on 21 March 2026.
The risk
The principal risk is that oil settles into a range that is painful but insufficient to generate visible demand destruction, the labour market’s deceleration is slow enough to be read as resilience, and the Federal Reserve finds cover to stay on hold through year end. This is a timing risk rather than a structural one. A rapid resolution carries near-term risk for the rates legs. The tanker leg performs well in that scenario. The three legs partially offset each other’s path risks.
A note on where this fits
This piece steps outside the ongoing AI series, published because the trade opportunity is live. The next issue returns to that series, examining why the distribution problem — where economic value migrates when the verifiable half of the economy compresses — may be the most consequential and least understood question in markets today.
Stray Narratives is published when the market demands a closer look. Nothing in this publication constitutes investment advice. All views are those of the author. Please read our full disclaimer.