

If you enjoy this article, please Like & Share, it means the world to me.
Click here for : Part1 - This is Part 2

Most market commentators spend their lives playing a trivial game: guessing where the S&P 500 will close in December or predicting when a recession will occur. The track record of point forecasting is atrocious, recessions also. The people who sound the most certain are almost always the ones who have forgotten their long history of being wrong.
I take a different approach. I focus on locating where we sit inside a much longer macro rhythm. If you understand the tide, you do not need to predict every individual wave. You simply need to know what assets are worth holding, which risks matter, and what noise you can safely ignore.
The market cycle everyone used to watch is the business cycle, a brief oscillation of expansion and contraction lasting a few years. But even that cycle is breaking down. Historically, the United States suffered an economic contraction roughly every six years. Over the last fifteen years, we have seen exactly one recession, and it lasted all of two months during the 2020 lockdown.
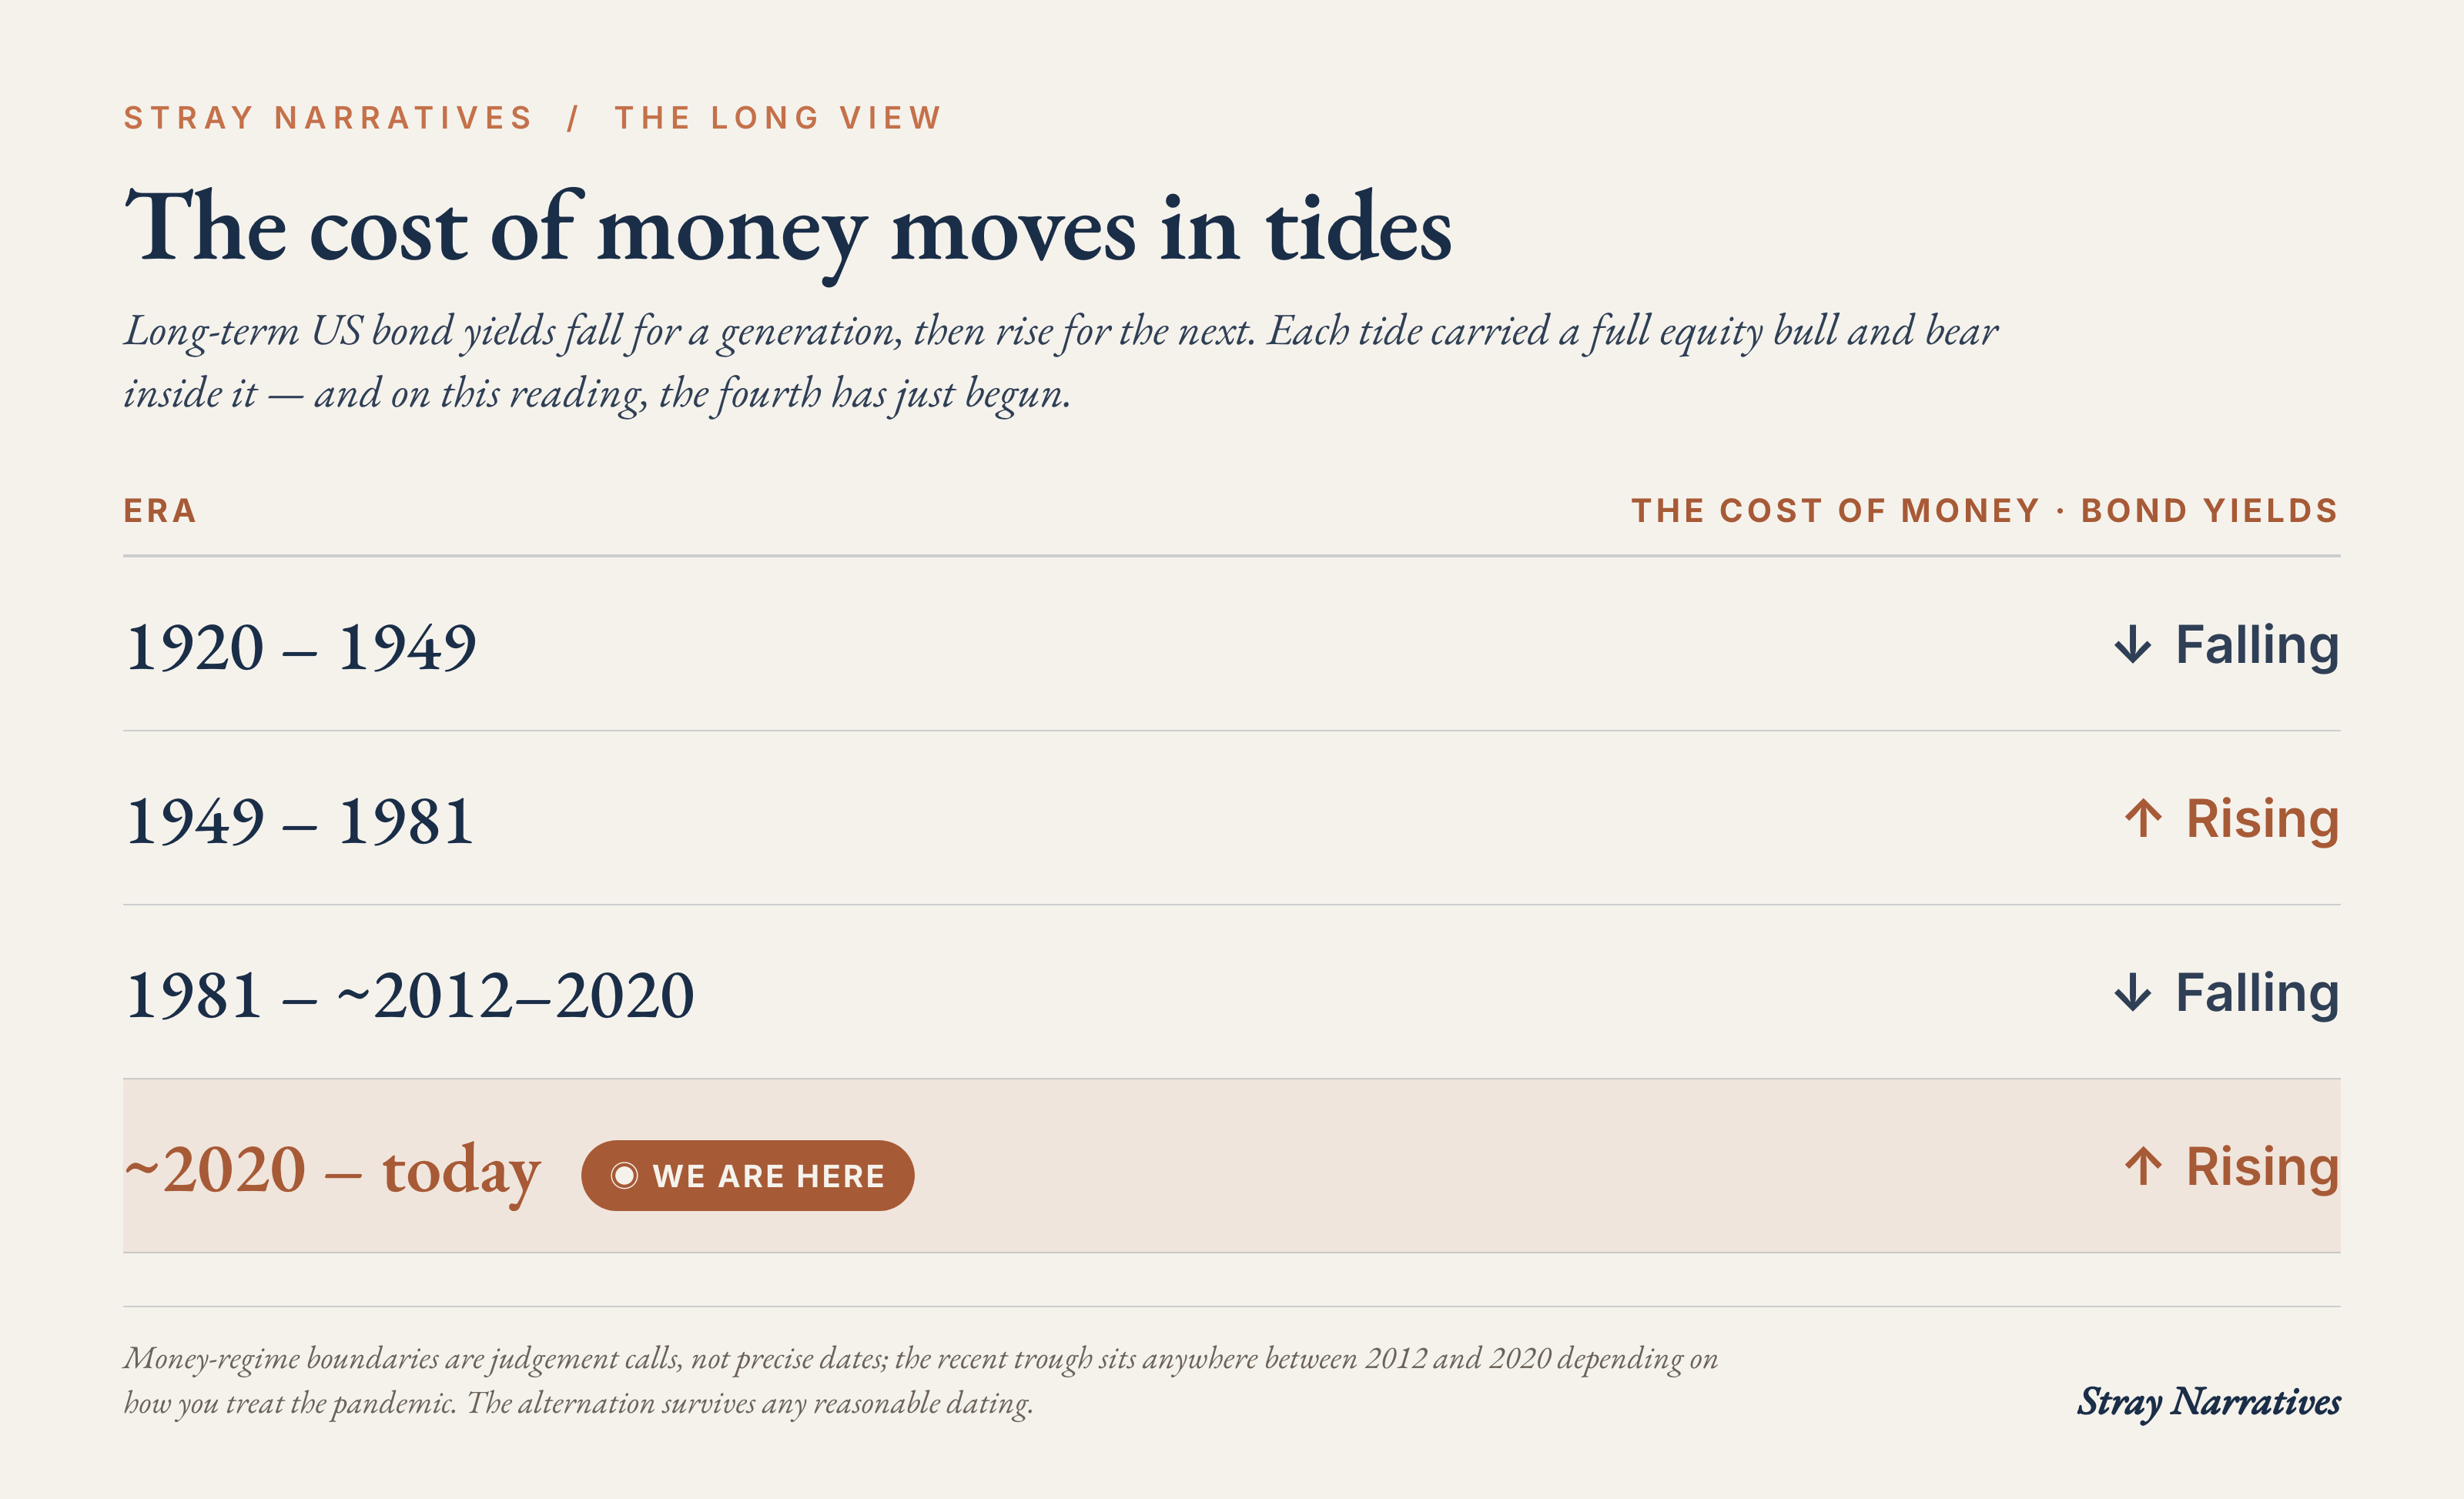
Beneath the business cycle runs a far more powerful engine: the debt and inflation super-cycle. It is a generational tide where the cost of money falls for thirty to forty years, and then rises for the next thirty to forty.
The Arithmetic of the Tides
You can date the turn in 1981 with precision when Volcker raised rates. The recent trough sits somewhere between 2012 and 2020, depending on how you account for emergency pandemic intervention. But the broader pattern holds regardless of the exact dating. The current rising leg is young and could still look like a cyclical bounce, but the fiscal mechanics behind it suggest the secular tide has officially turned.
These patterns persist because the underlying forces move at generational speed. Debt loads accumulate over decades. Demographics shift over half-centuries. Inflation psychology, the quiet assumptions that workers and companies carry into salary negotiations and corporate contracts, takes an entire generation to learn and another to unlearn.
We only have two and a half full regime transitions in modern US history:
The post-war inflation run
The Volcker reversal of 1981
The structural turn unfolding right now
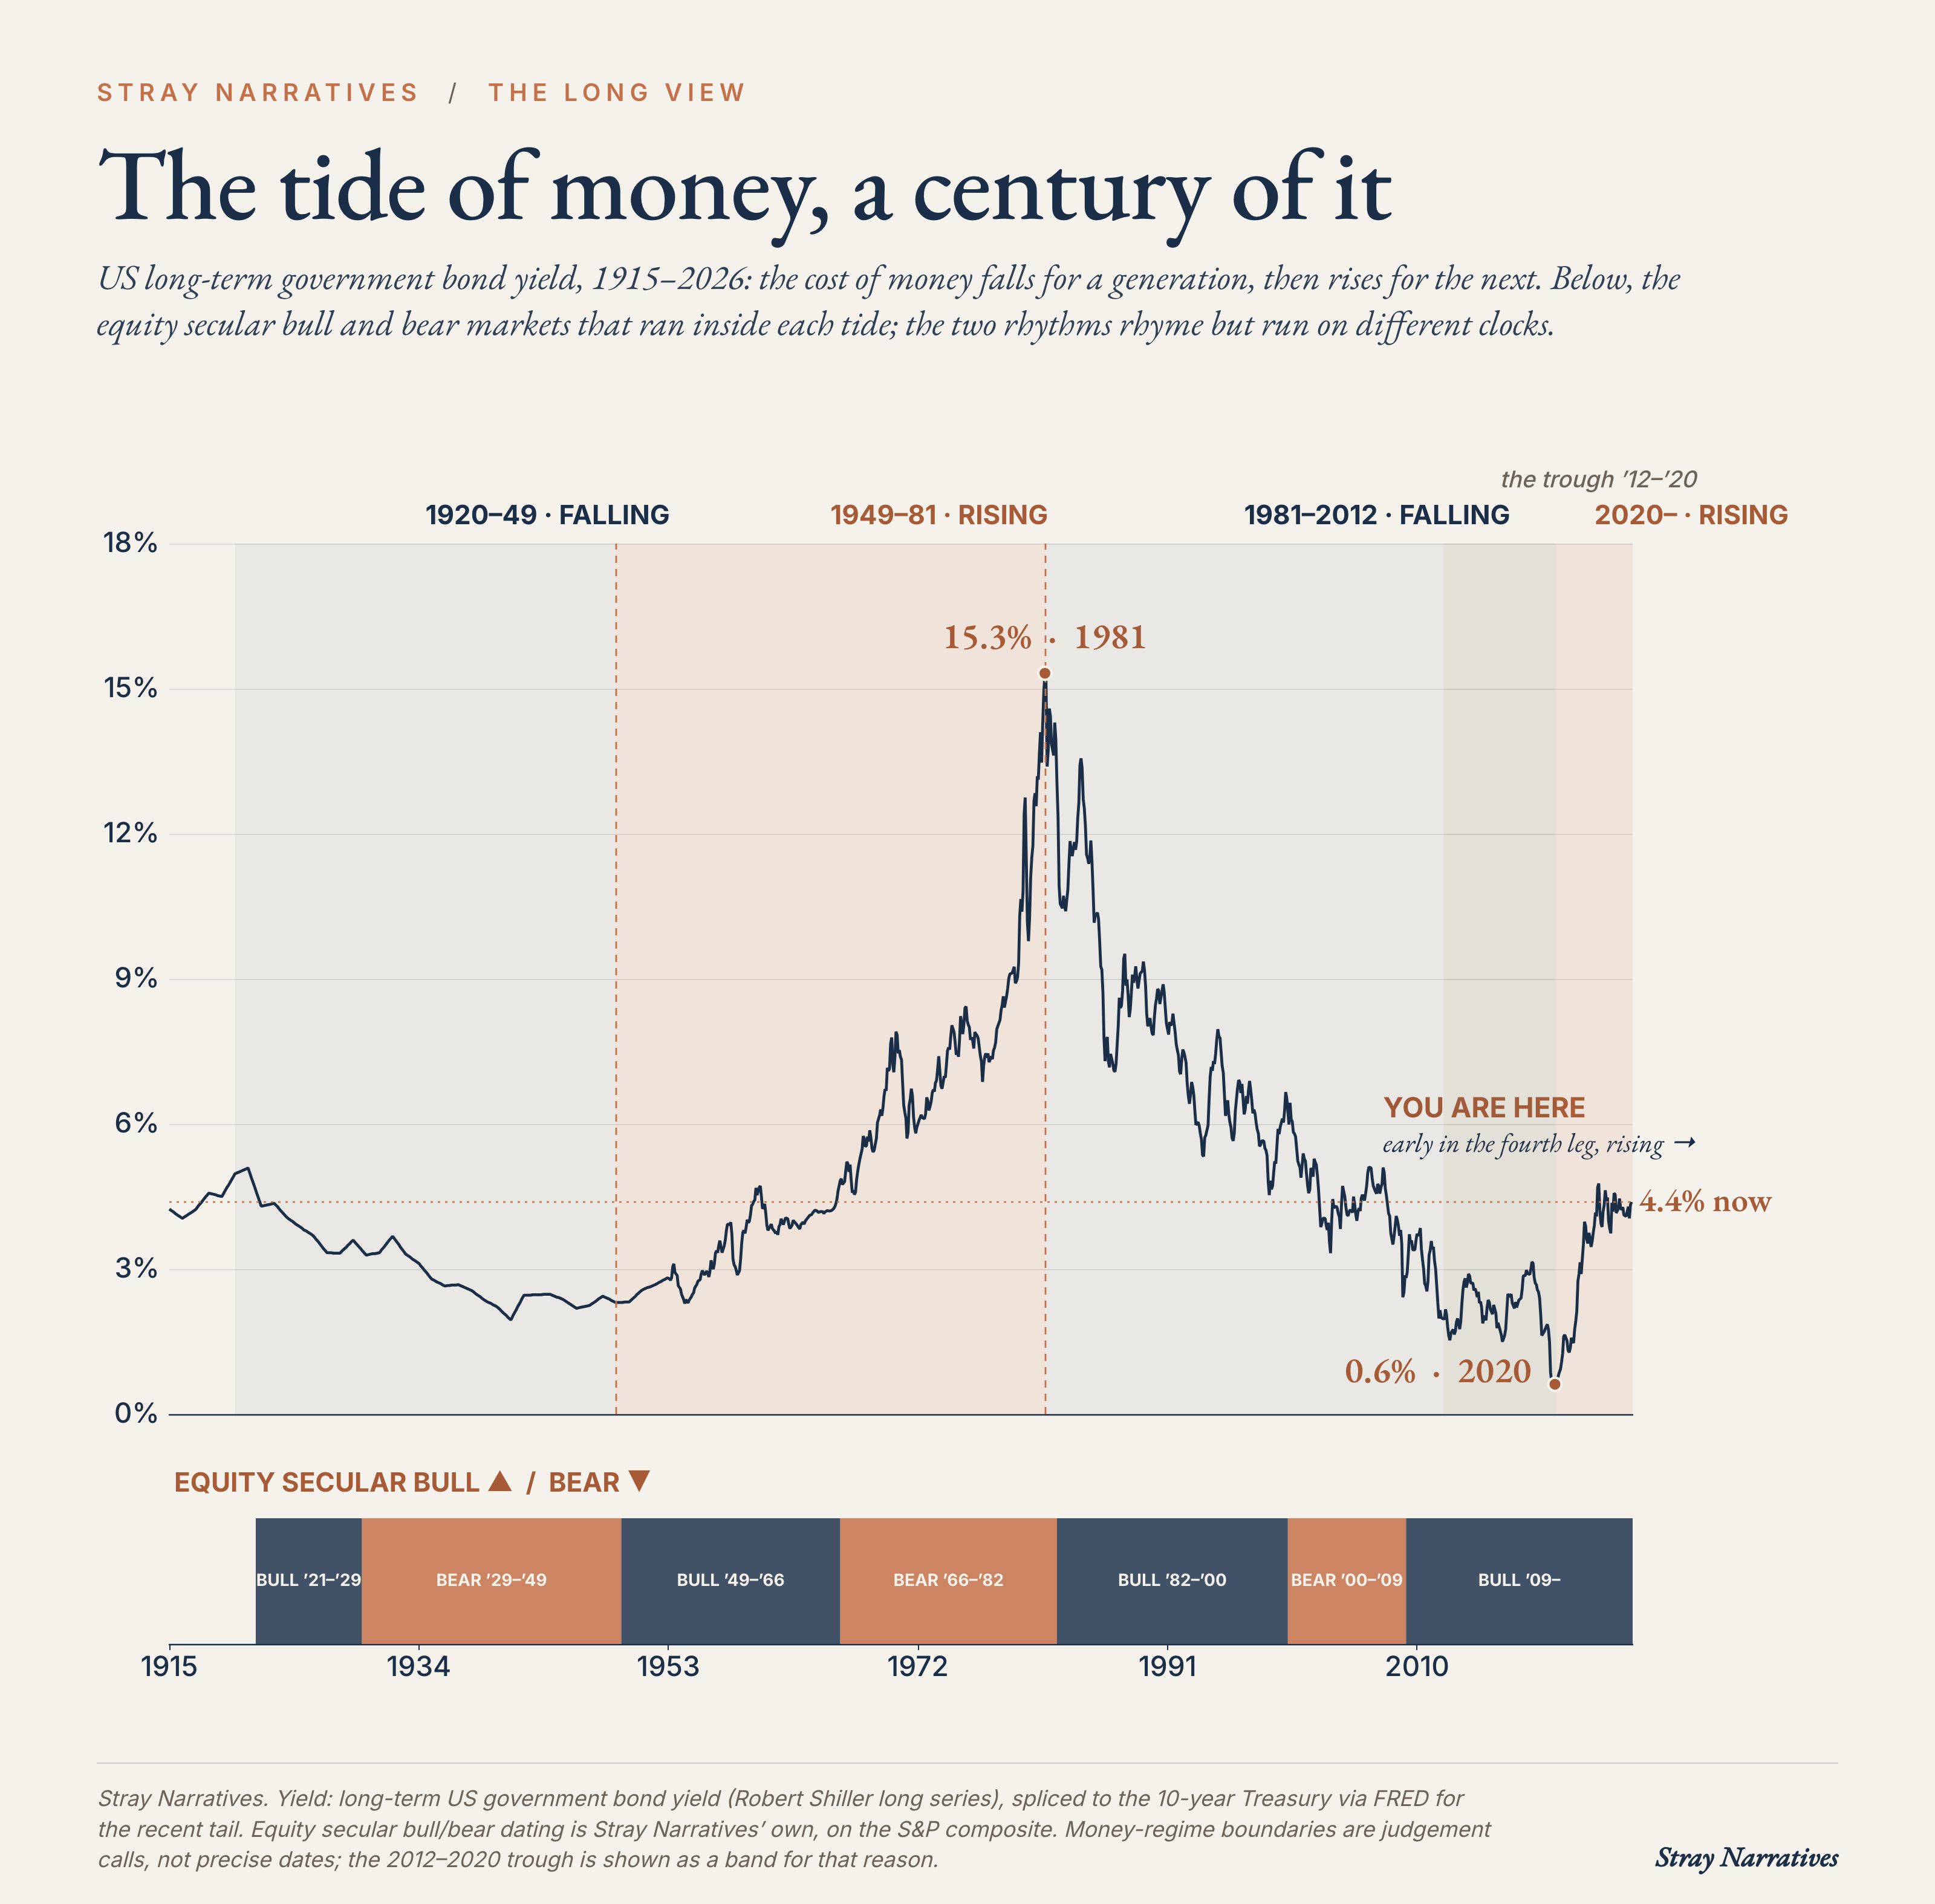
When you have a sample size that small, you cannot rely on statistical overfitting. You have to look at the current, real-world evidence: valuations, credit conditions, and of course fiscal policy.
What Wins When the Tide Flips
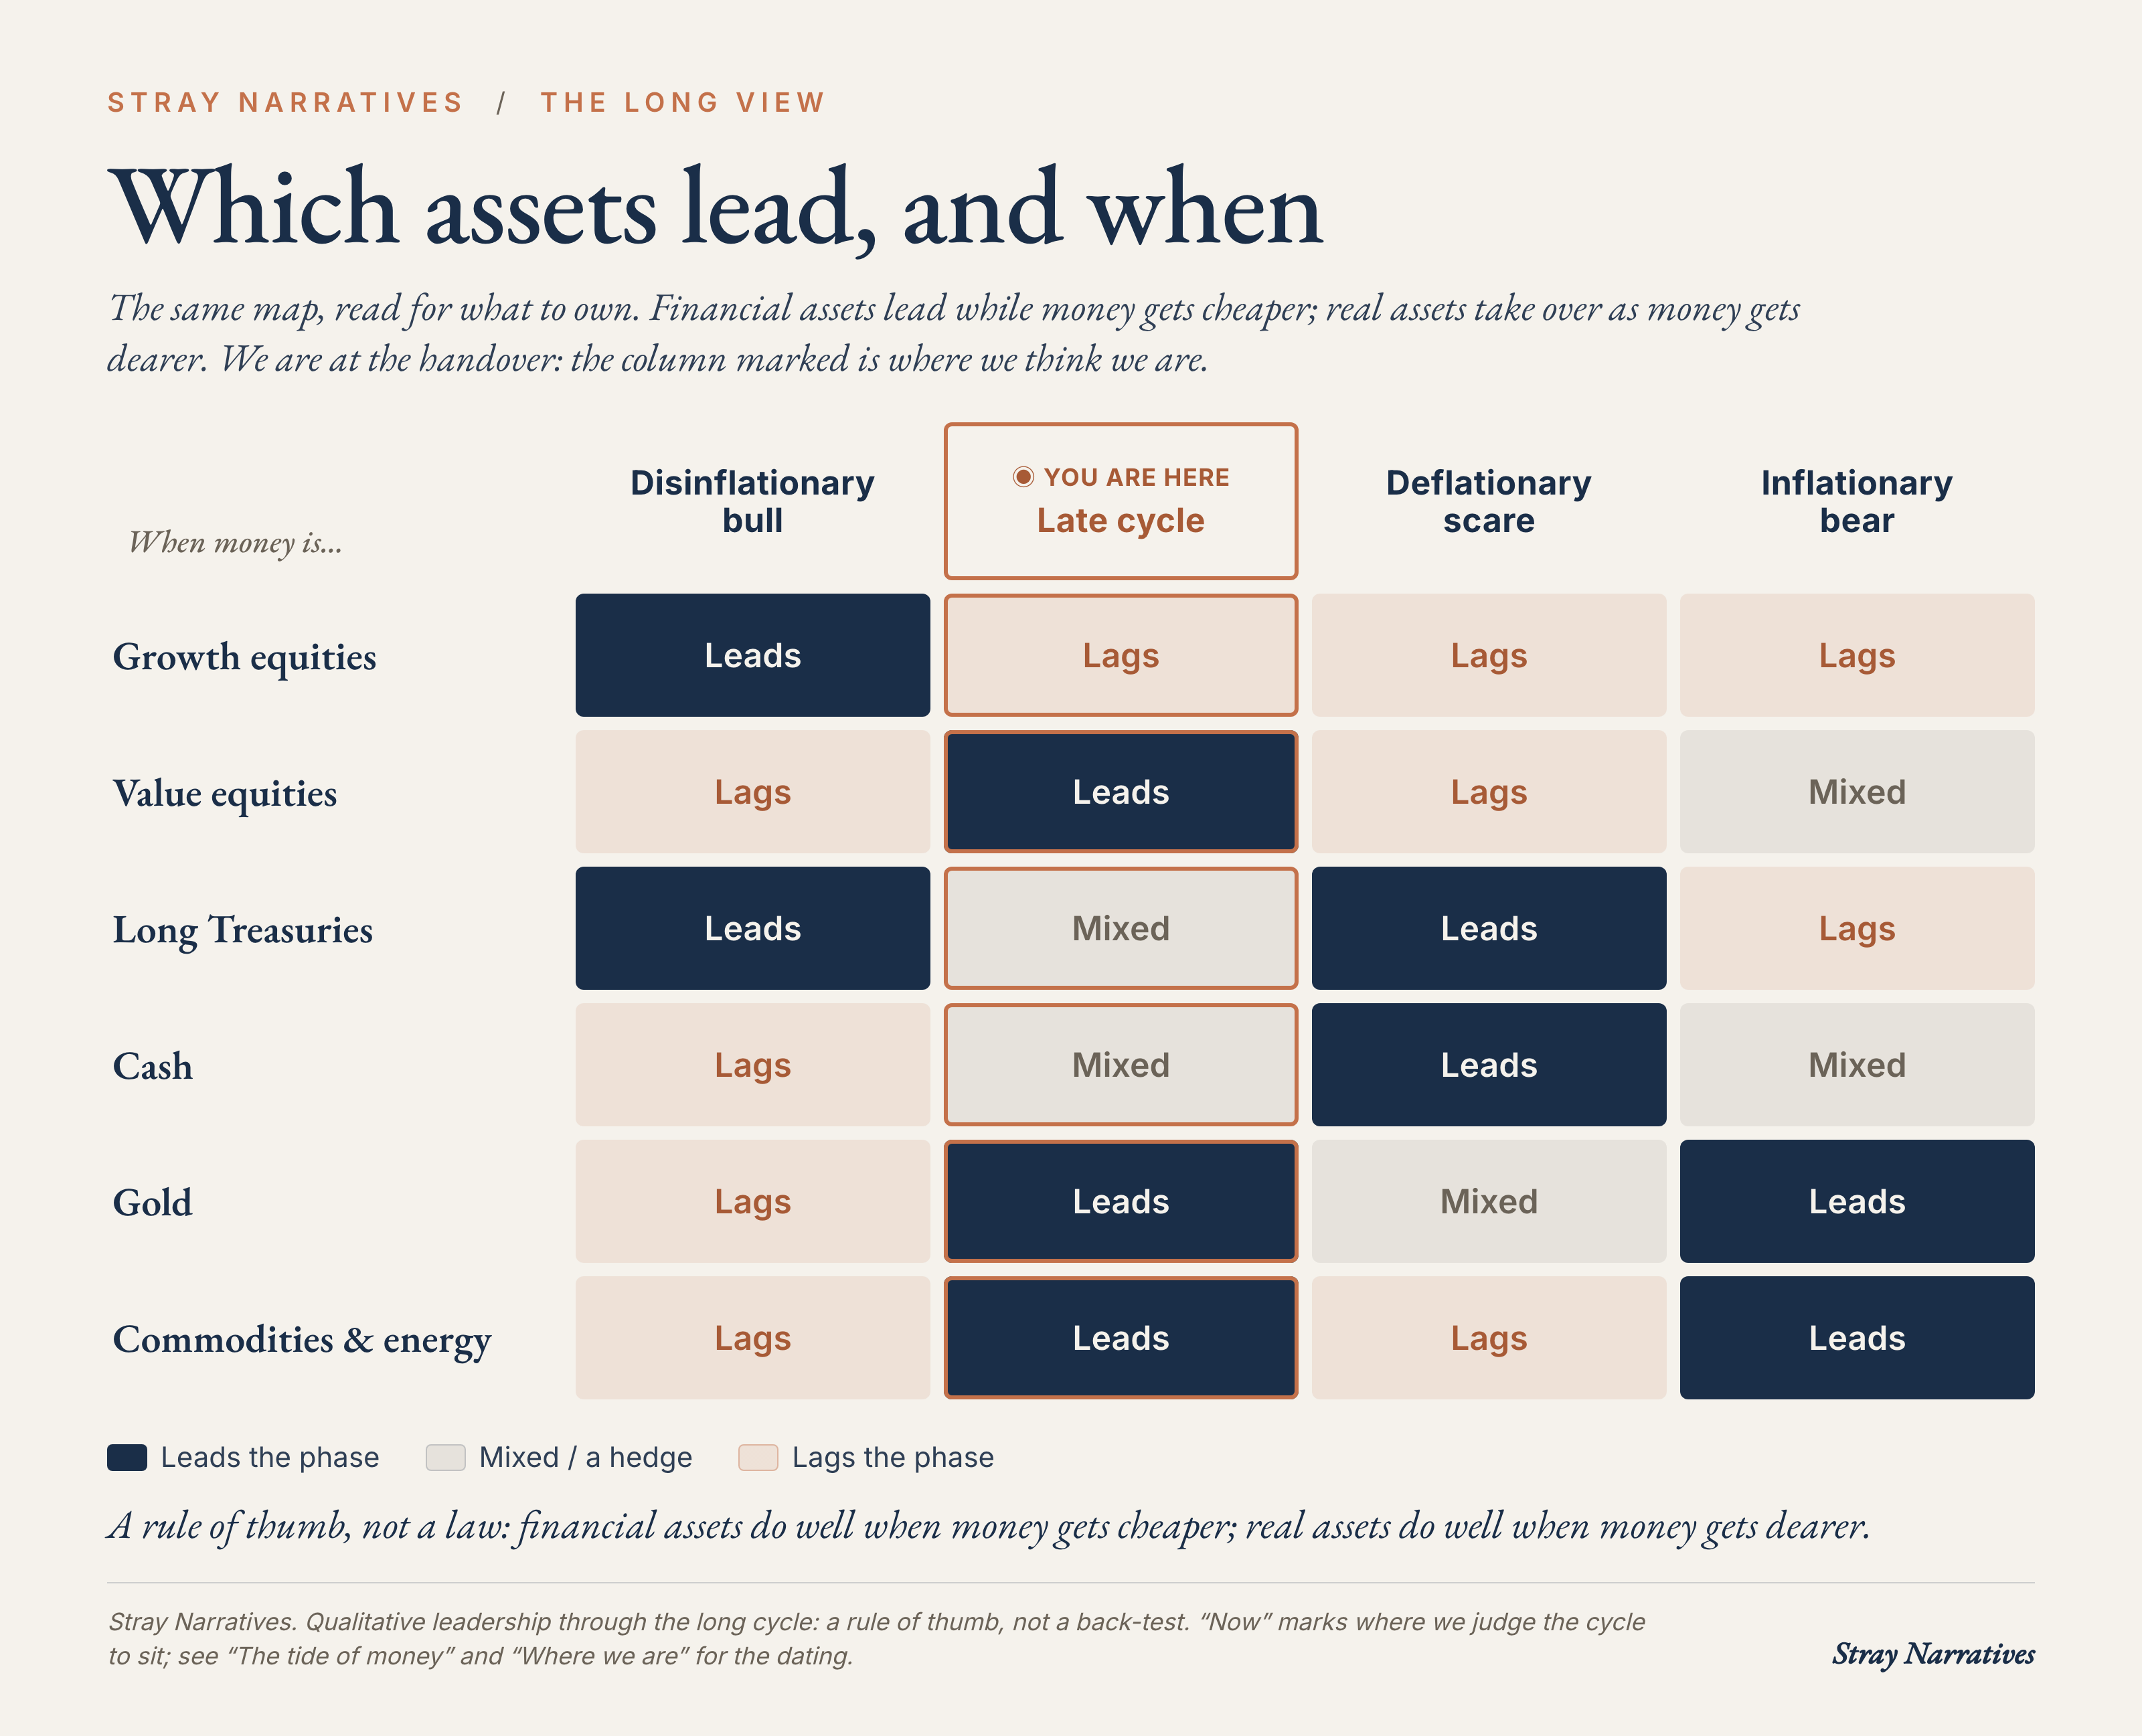
Where you sit in this cycle dictates which assets outperform.
Era 1: Falling Cost of Money
When money gets cheaper across a multi-decade span, financial assets dominate. Equities surge because a lower discount rate makes future earnings worth more today. Growth stocks perform best of all because their projected earnings sit furthest out in time. Bonds rally alongside stocks. Gold, energy, and real assets lag behind.
Era 2: Rising Cost of Money
When money gets dearer, the order completely inverts. Commodities, tangible assets, and gold lead the board. Bonds lose real money as yields climb. The most expensive growth stocks get crushed as the same discount-rate arithmetic that helped them begins to hurt them.
The transition between these two regimes is where we sit today. The assets that led for forty years are now concentrated inside passive market indices and institutional portfolios to an extreme degree (I will be writing in coming issues about passive and how it is impacting market stability). That concentration is precisely where the most capital will be surrendered as the regime shifts.
How We Got Here: The Anatomy of a Late-Stage Bull
The secular bull market that most investors view as “normal” was built on a single tailwind: relentless disinflation.
From the early 1980s onward, the cost of money fell almost continuously. Volcker broke 1970s inflation, globalization injected a billion lower-cost workers into the global economy to suppress wages, and the discount rate applied to corporate earnings plummeted. A huge portion of what passed for investment genius over the last forty years was simply this discount-rate math at work, aggressively amplified by passive index flows and corporate stock buybacks.
Dated from the 2009 low, this bull market is about seventeen years old. It can be measured against post-war secular bulls that historically lasted sixteen to eighteen years, so if history is any guide, this one is pretty old.
The valuation metrics look even more stretched than the calendar count:
Shiller CAPE Ratio: Sitting above 40, more than double its historical average.
Index Concentration: The ten largest names make up roughly 40% of the entire index, double their weight from a decade ago.
Profit Margins: Put simply, at historic highs.
Retail Allocation: Household equity holdings sit near record territory, the five highest readings in the history of the series are all from the last eighteen months.
An expensive market, operating on peak profit margins, owned by almost everyone: this is the exact cocktail that has preceded every major secular top in history.
Every great secular bull relies on a narrative technology at its core. It was radio in the 1920s, the internet in the 1990s, and artificial intelligence today. That technology explains the enthusiasm fueling the move, but it tells you nothing about when you have to stop dancing and the music stops.
Crucial Distinction: A high valuation is not a sell signal on its own.
The conditions that historically end secular bull markets are a tightening credit environment and a central bank out of ammunition. Neither is present today. The yield curve is positively sloped, credit conditions are loosening, earnings are growing, and the Federal Reserve has ample room to cut rates. The massive AI capital expenditure boom continues to inflate corporate earnings while concentrating systemic fragility.
My positioning reflects this reality: I remain invested through this final leg. The returns during a final melt-up are massive, but the exit door will be narrow and violently crowded. This is the exact moment to quietly structure hedges, because the odds of timing the top are close to zero (but so exhilarating to try).
The Inflationary Aftermath
When this bull market eventually terminates, the regime that follows will be defined by recurring bouts of inflation.
The driving force is political dominance. When sovereign debt expands beyond what economic growth or taxation can service, governments historically inflate away the real burden rather than default or enforce fiscal austerity. Modern political incentives across both major US parties favor spending over consolidation. At the same time, the world is re-arming and re-shoring supply chains, swapping a supply-abundant world for a supply-constrained one. Persistent deficits meeting structural supply constraints is the classic recipe for volatile inflation.
Addressing the Three Main Objections
1. “Look at Japan”
Critics argue Japan ran massive deficits for thirty years and generated nothing but deflation. This comparison fails for three clear reasons:
Balance Sheet Dynamics: Japan’s government spending was filling a crater created by a private sector aggressively paying down debt. US deficits today run alongside a private sector whose balance sheet repair is finished and whose debt service is well below 2007 levels. US deficits are net additive to demand.
Demographic Isolation: Japan aged first and alone, offshoring production to cheap foreign labor. A world aging simultaneously across all major economies cannot use that trick.
Creditor vs. Debtor: Japan ran its experiment as the world’s largest creditor nation, funded by captive domestic savings. The US is a twin-deficit debtor dependent on foreign capital. A debtor country engaging in fiscal excess sees the pressure hit its currency and domestic price levels.
2. “AI is Deflationary”
A technology driving the cost of intelligence toward zero is undeniably a supply-side disinflationary force, much like China entering the global trade system. But AI is a supply-side shock, while our macro regime is driven by demand.
Cheaper production does not stop fiscal deficits from flowing directly into economy-wide spending. In fact, if AI displaces workers on a large scale, the political pressure for government transfers and deficits will increase dramatically. The technology that makes goods cheaper to produce simultaneously strengthens the political imperative to print and spend.
3. “The Wage-Price Spiral is Dead”
Labour lacks the unionization and contractual indexing it held in the 1970s, so price shocks burn out faster rather than compounding automatically into higher wage rounds.
This mechanism is real, which is why inflation will arrive as a series of sharp, unpredictable steps rather than a smooth vertical climb. But a broken wage-price spiral only limits how fast inflation accelerates; it does not stop it from persisting. When the inflationary impulse is fiscal, driven by government transfers into a supply-constrained real economy during every downturn, the persistence comes from the deficits, not the wage negotiations.
The Trap: Expect the Decoy First
Here is where most macro thinkers get caught out: sequencing.
The transition to a high-inflation regime might not happen in a straight line. A secular bull market so heavily dependent on a concentrated capital-spending boom usually ends in a sudden deflationary scare:
Risk assets sell off sharply.
Credit spreads widen rapidly.
Capital flees into long-dated US Treasuries.
The Federal Reserve cuts interest rates aggressively.
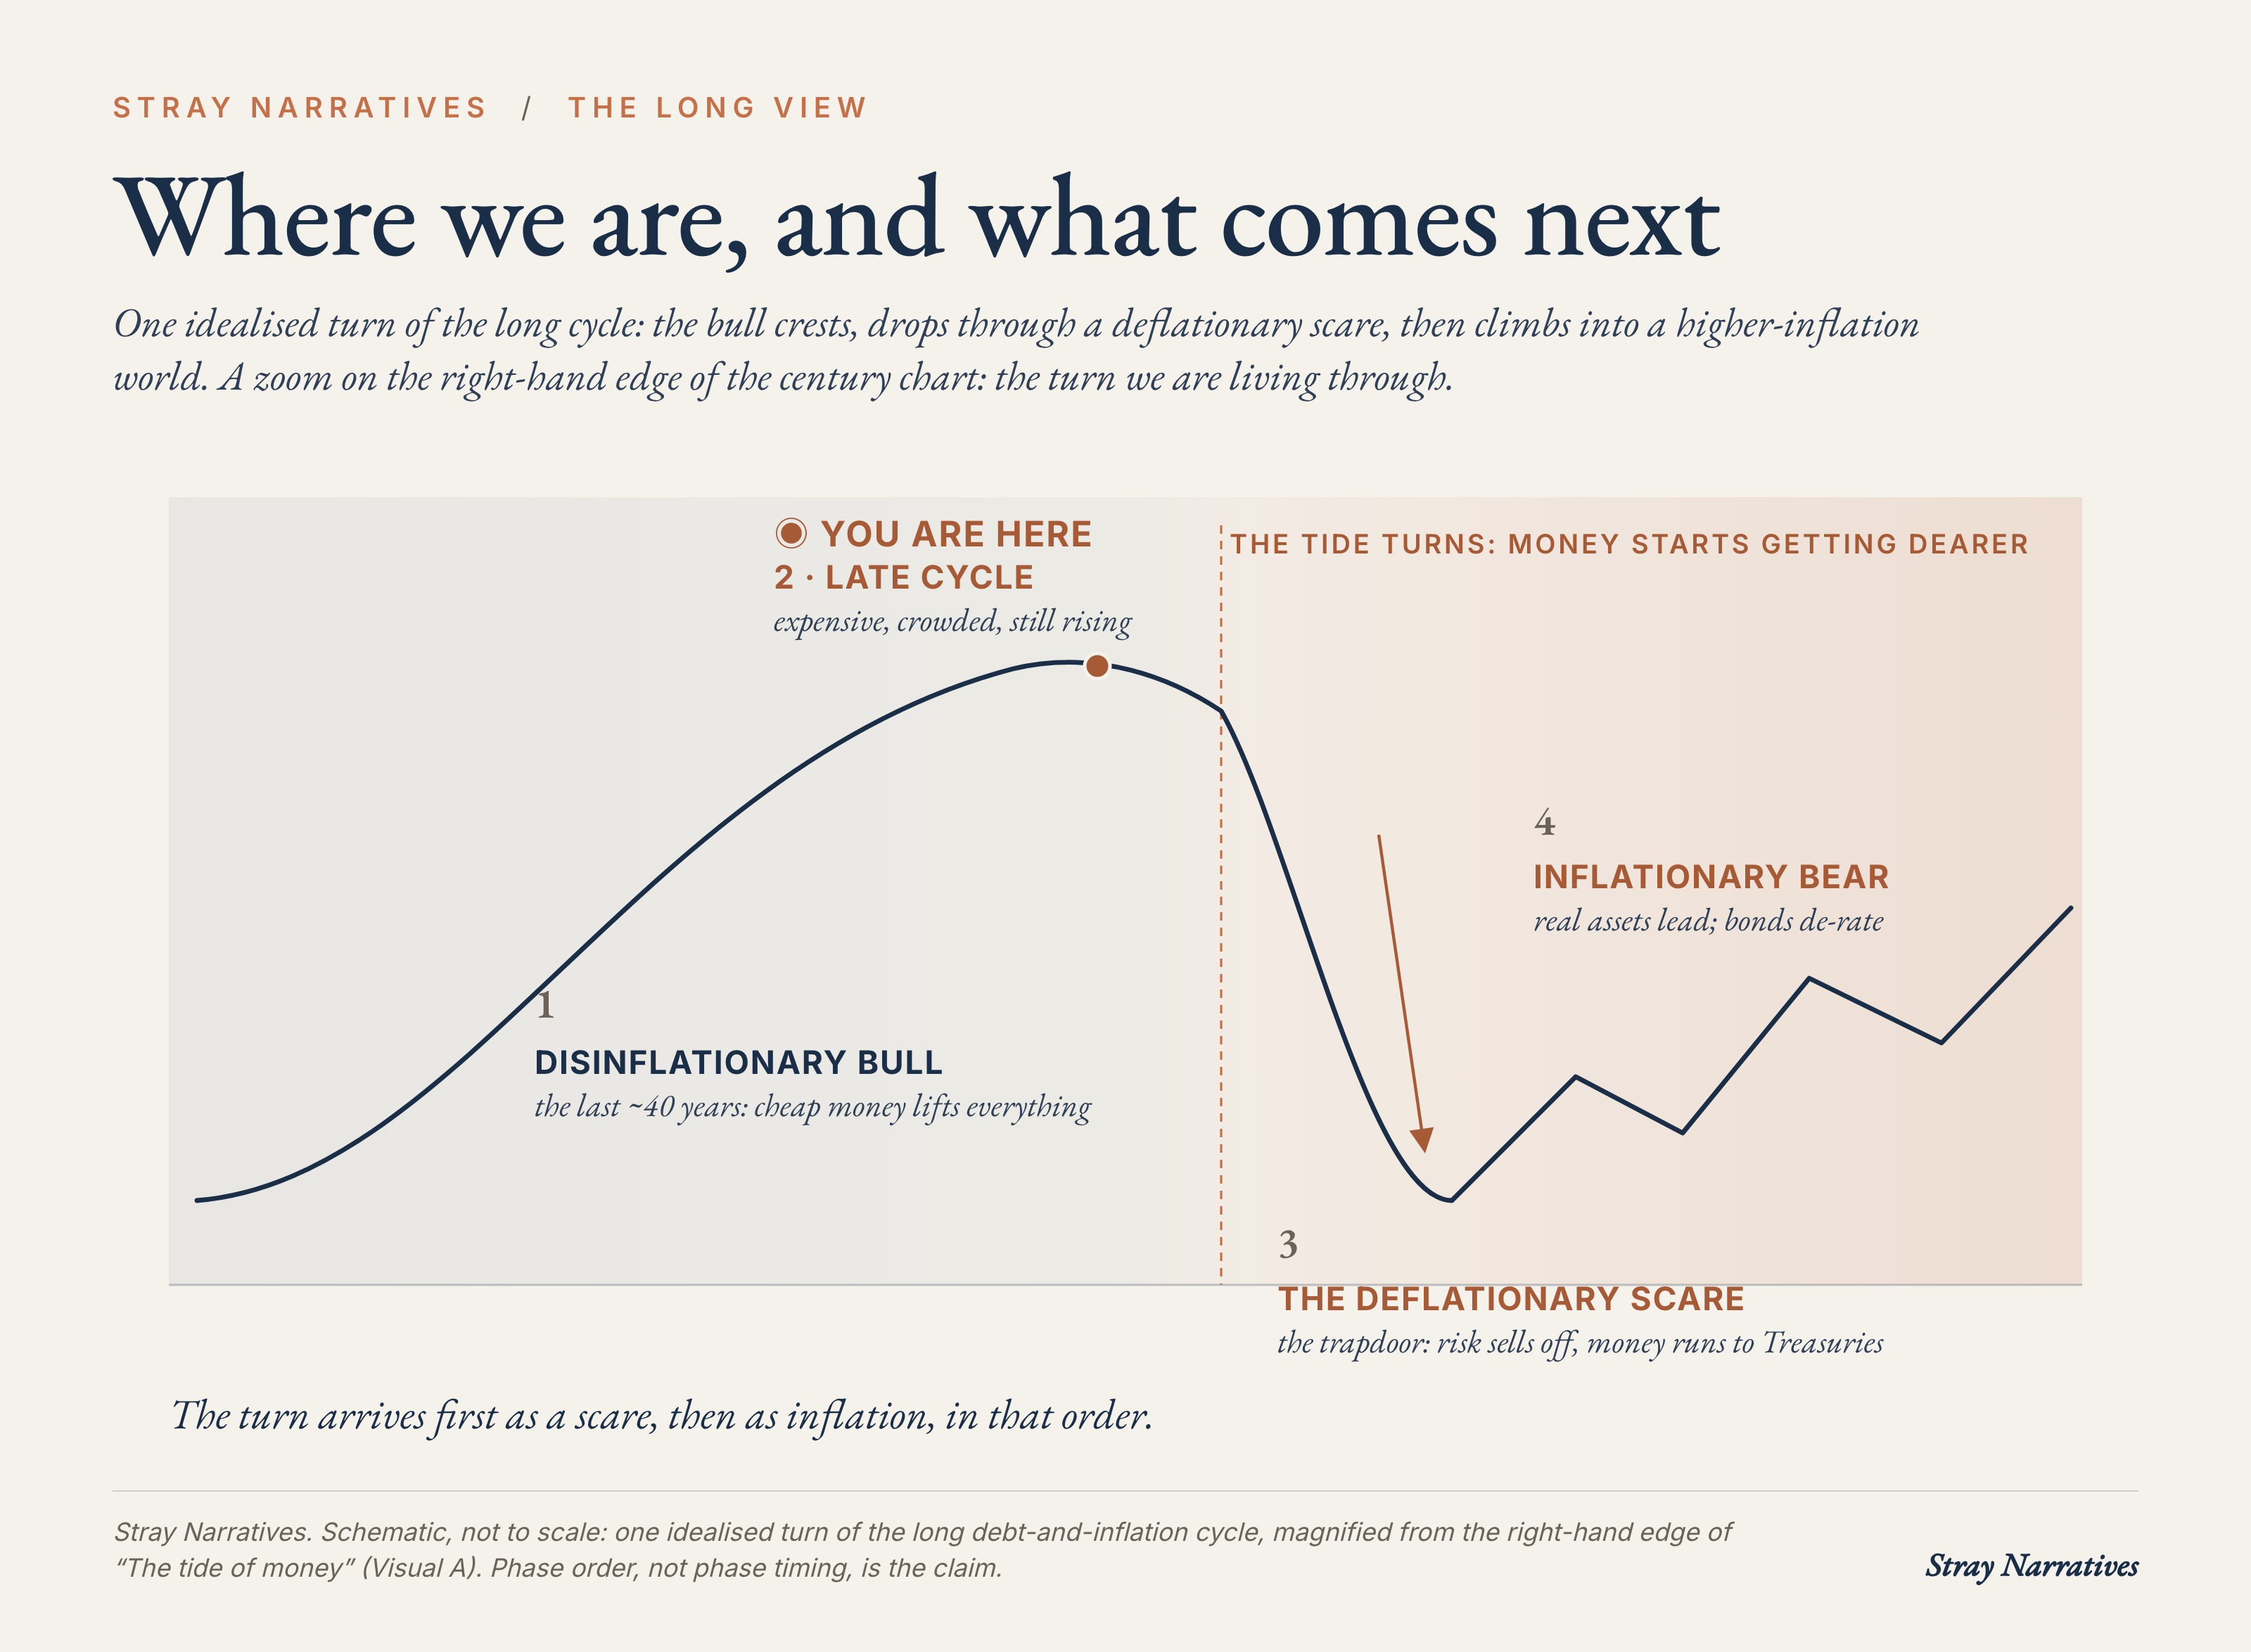
This first phase will probably look and feel like 2008. It will fool a generation of investors into thinking the old deflationary playbook still works, tempting them to pile back into long-duration paper and growth tech.
That deflationary crash will be the decoy. The massive fiscal stimulus deployed to counter that shock will travel directly into the real economy rather than getting trapped on bank balance sheets. That is when the secular turn asserts itself, cementing a decade defined by volatile, step-function inflation.
Add to this a massive, completely untapped powder keg of demand: trapped home equity. Years of relentless real estate appreciation have handed households a gigantic pool of wealth, but it currently sits frozen behind high mortgage rates. Owners' equity in US real estate is $34.9 trillion as of Q1 2026, with the 30-year mortgage at 6.69%. That is larger than the entire US economy. That number is roughly the size of US GDP. When the Fed inevitably slashes rates to arrest that initial deflationary scare, they will inadvertently light the fuse on this dormant savings pool. Millions of homeowners will finally refinance, cash out, and spend. That newly unlocked wealth will flood directly into the real economy, throwing a massive secondary wave of fuel onto the recovery.
Where This Leaves Us
The long-cycle framework does not attempt to pinpoint the exact Tuesday the market tops out. It tells you where you are standing.
We are late in a forty-year decline in the cost of money, navigating the final leg of an equity bull market that is expensive, narrowly concentrated, and widely owned at peak corporate earnings.
I am actually creating a full “Regime Board” to help you, my readers, keep track of the indicators I am following and estimate how close we might be from the edge of the cliff. I will be sharing it with you when it is ready.
The path ahead involves a likely sharp deflationary scare first, where capital runs to traditional safety, followed by a far more volatile inflationary era. Because those two phases reward completely different asset classes, getting the sequence right matters far more than guessing the exact date.
Play the final leg of the bull market, but stay close to the exit. The regime change is coming, and it will not announce itself nicely.