

As always, if you enjoy this article, please Like & Share, it means the world to me, really! Click here for : Part1 - Part 2 - Part 3 - This is Part 4

Last year, Alphabet spent $45.7 billion buying its own shares. This year, its filings report a different number. Zero. Zero, in the first quarter, and zero again in the second [8].
Meta spent $26.3 billion last year. This year: zero, and zero [8]. Oracle bought $0.1 billion across its entire fiscal year. Amazon has bought nothing since 2022. Of the five giants building the AI era, only Microsoft still buys its own stock, at about $4.6 billion a quarter, and even that is shrinking [8].
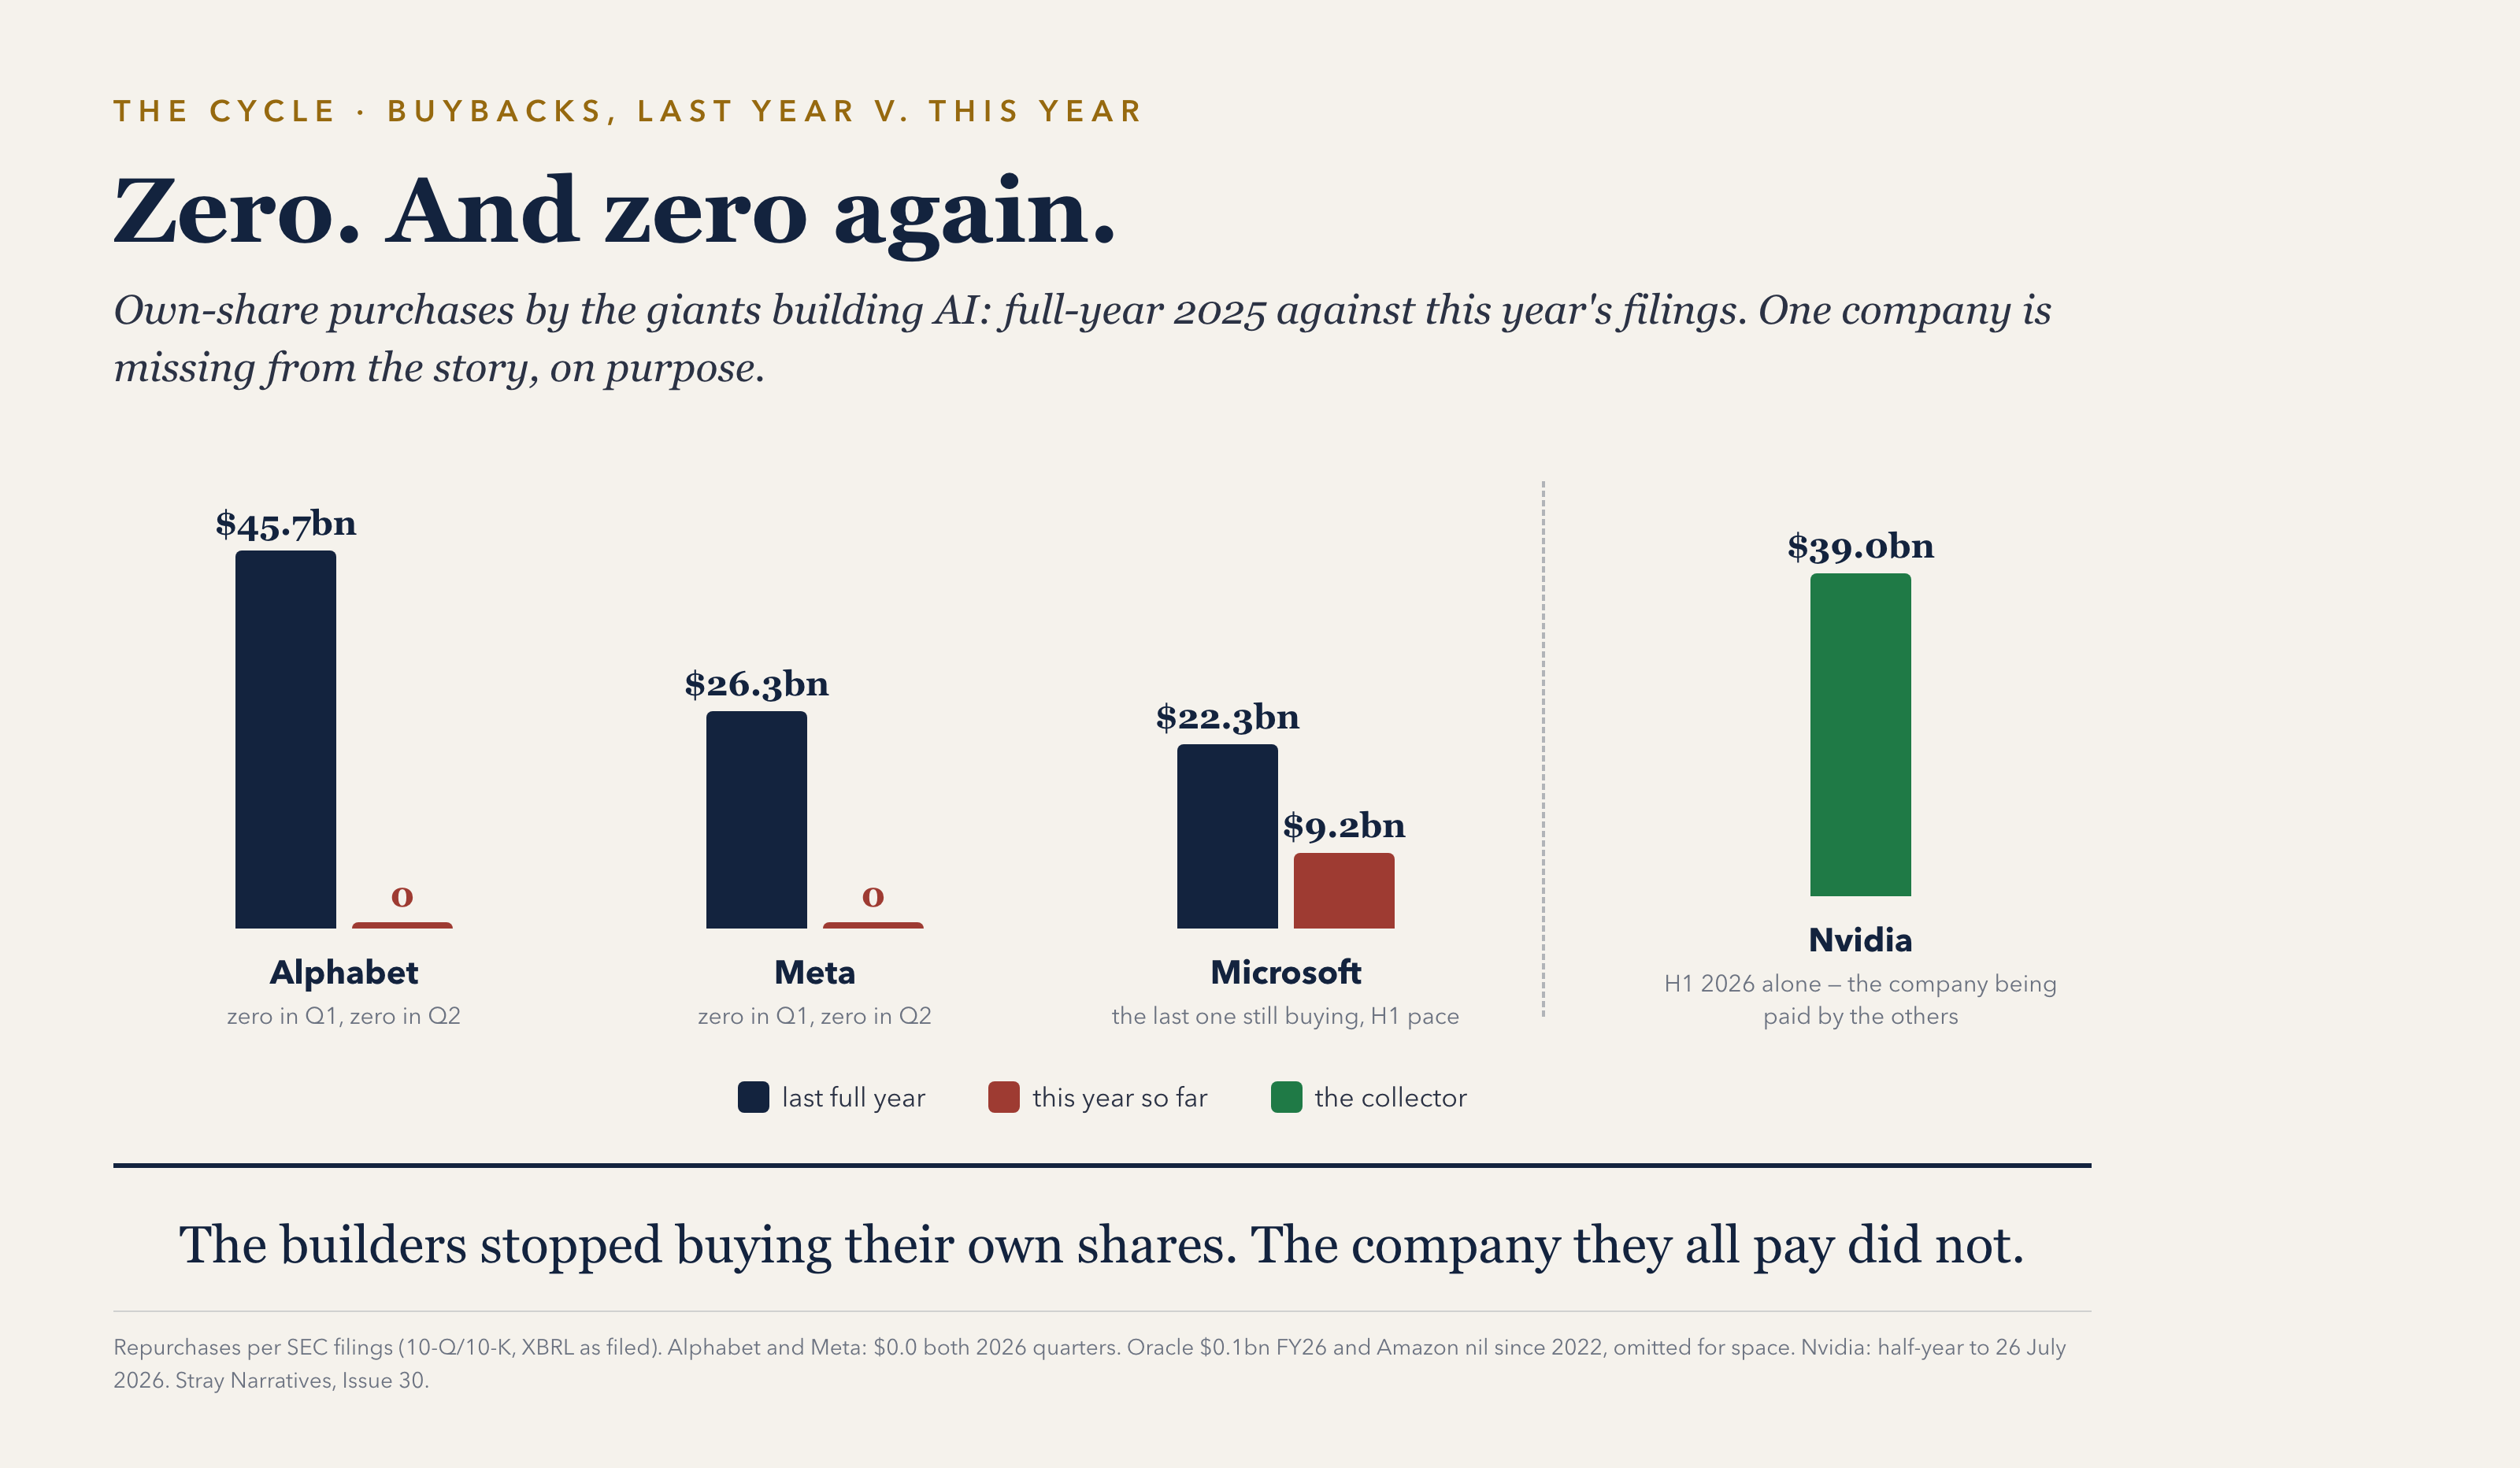
The investors who know these businesses best, the companies themselves, have stopped buying their shares. And they have not merely stopped. Alphabet sold $18 billion of new stock in June and set up a programme to sell $40 billion more, quietly, over time [9]. The best-informed buyer in the market has crossed to the other side.
The largest buyer nobody talks about
Ask people who the biggest buyer of American shares is and they will guess pension funds, or index funds, or foreigners. The answer, for the past decade, was none of these. It was the companies themselves. Buybacks across the S&P 500 ran at a trillion dollars in the most recent twelve months on record, a fresh all-time high [12]. That is more than my entire estimate of the automatic retirement bid, and larger than any other source of demand I can size. For ten years, the largest buyer in the American stock market was the American stock market.
And the buying was heaviest exactly where the prices rose most. In 2021, the five giants that pay for the data centres, Microsoft, Amazon, Alphabet, Meta and Oracle, retired a net $144 billion of their own stock in one year [6].
Meanwhile the money coming in from outside changed character. Every month, retirement contributions flow into index funds that buy every stock automatically, in proportion to size, at whatever the price happens to be. I estimate that automatic bid at roughly $500 to 800 billion a year, built from government retirement-plan filings and industry fund-flow data [7]. It is set by payrolls and demographics, not by opinions. And because the index buys by size, roughly a third of every automatic dollar lands on the handful of giant stocks at the top [7].
Now put the machine together:
A price-blind bid of hundreds of billions a year flowed in.
The largest buyer in the market, the companies, was removing shares at the same time.
Demand that never asks the price, chasing a supply that was shrinking. Prices melted up, fastest at the top. Valuation never had to clear anything. Scarcity did the work.
You might object that these companies never looked expensive the way bubbles look expensive, because they are among the most profitable enterprises ever built. True, and that is exactly why the machine went unnoticed. The profits were real but the profits were also the fuel. Cash earnings funded the buybacks, the buybacks shrank the share count and a shrinking share count makes earnings per share grow faster than earnings. The price climbed, earnings per share climbed with it, and the ratio between them stayed respectable. A reasonable-looking valuation was not evidence against the machine. It was the machine’s product.
The switch
They did not stop because they wanted to but because the five spent $330 billion on data centres and equipment in the first half of this year, a pace near $660 billion a year, roughly 96 cents of every dollar their operations generate in cash [8]. Add the dividends they still pay and the outflow exceeds the cash coming in. Two of the five, Amazon and Oracle, already outspend their operations outright [8].
So the gap is being filled the way it always eventually is: with paper. About $90 billion of new borrowing sits in the half-year filings, and market data indicates $150 billion or more across the five [8][9]. And the equity, from the companies’ own documents [9]. Alphabet’s programme totals $84.75 billion: $18 billion of common stock and $16.75 billion of convertibles sold at once, the $10 billion Berkshire placement, and the quiet $40 billion to come. Together, by press tallies, the largest American follow-on on record. Meta, $25 billion of bonds out to forty-year maturities. Oracle, a $45 to 50 billion financing plan, with $25 billion of bonds and a $20 billion share-sale programme launched. Amazon, $67 billion of long-term debt in six months [8]. Alibaba, $10 billion of new shares, by press tallies Hong Kong’s largest-ever follow-on.
Notice who is missing. Nvidia, the company at the very centre of the boom, repurchased $39 billion of its own stock in the same six months, more than four times what the five builders managed together [8]. The five spend the capex whilst Nvidia collects it.
The whole switch, in one number. In 2021 the five removed about $95 billion a year of stock from the market, net of what they issue to employees. This year they are adding stock at a pace of roughly $140 billion a year, counting the buybacks that remain, the shares issued to staff, and the new shares sold [8]. From minus $95 billion to plus $140 billion: a swing of some $235 billion a year, concentrated at the very top of the index, where the automatic bid lands heaviest.
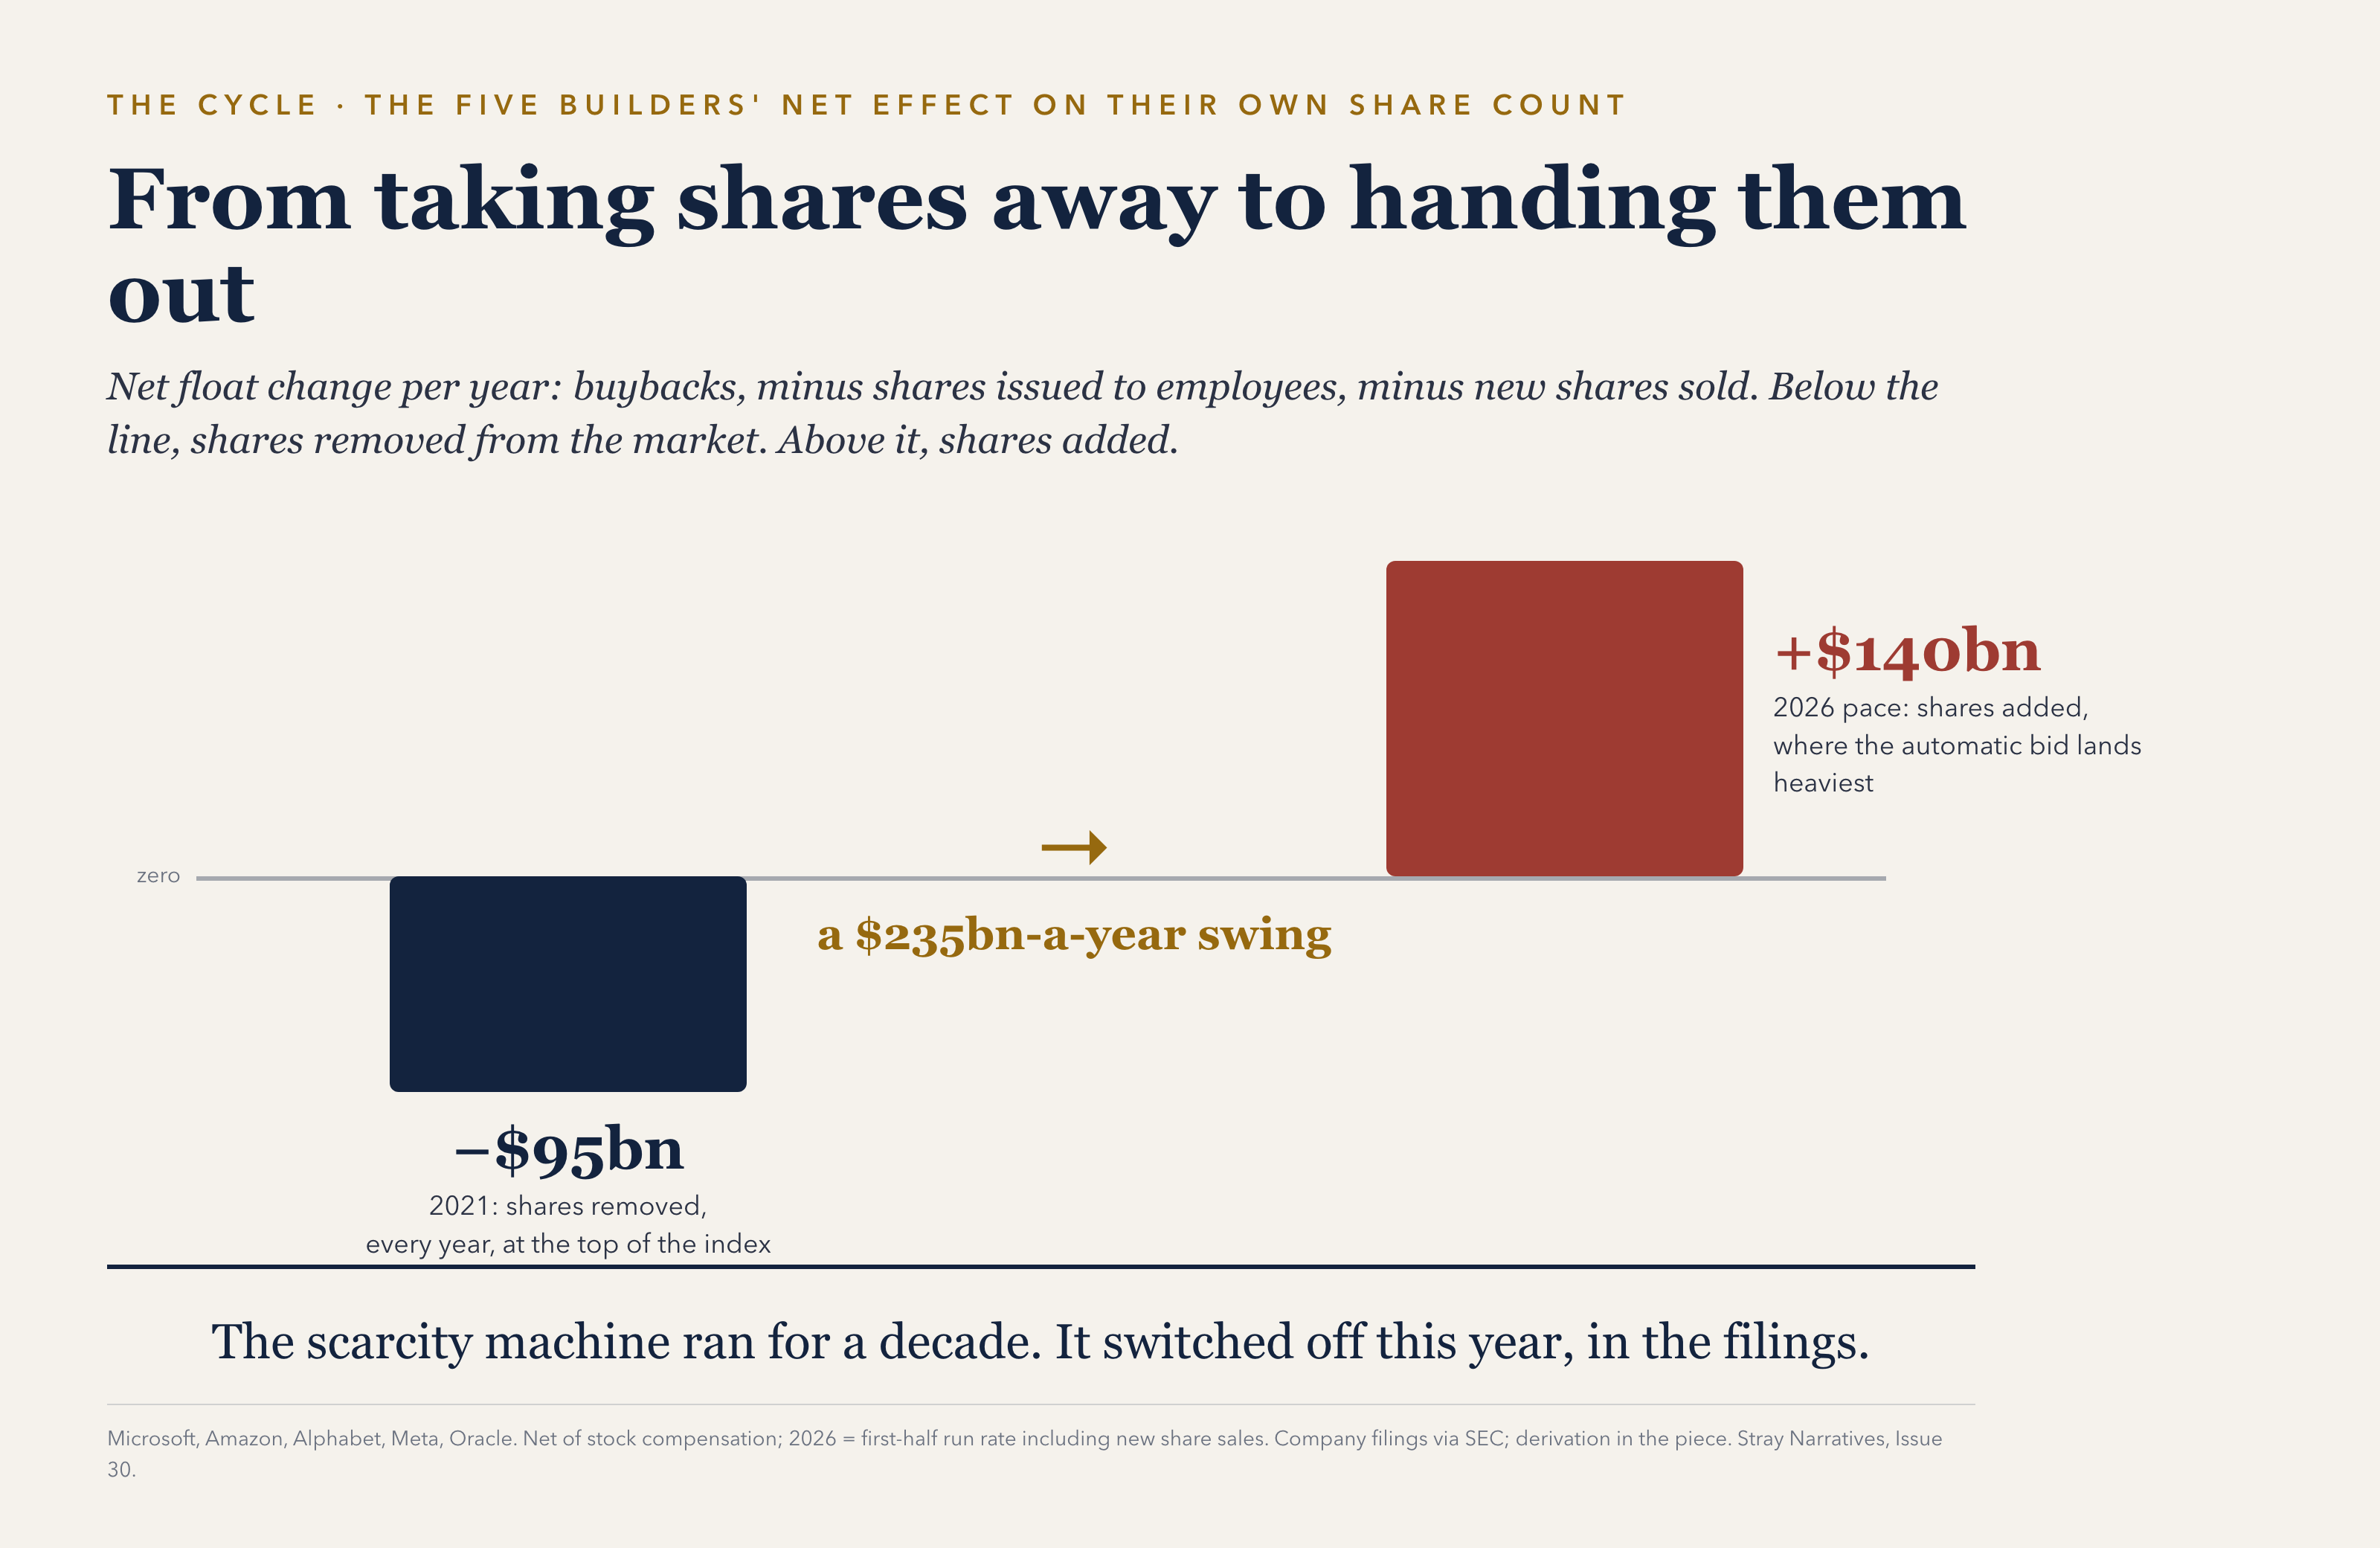
The valuations that looked sensible on a shrinking share count now need to look sensible on a growing one.
The other side of the trade
So who buys what the best-informed holders are selling?
If you have a retirement account, the answer includes you. Part of every paycheck buys these exact stocks automatically, in proportion to their size, at whatever the price is that day. That is not a criticism; the automatic bid is the sane default for most people. But see the trade clearly. For a decade, your monthly contribution competed with the companies themselves to buy a shrinking pool of shares, which is a wonderful position to be in. From this year, your contribution is absorbing a growing pool of shares, some of it sold to you directly by the companies, which is a different position entirely.
And the queue on the selling side is forming. SpaceX went public this spring and raised $75 billion at a $1.7 trillion valuation, the largest deal ever; it rose 19% on the first day [10]. OpenAI confidentially submitted a draft listing document in May, by its own announcement [11]. Anthropic is widely reported to have done the same in June, at a reported target valuation around $2 trillion. None of that is confirmed by the company; the reports are press [11]. American initial public offering proceeds stand at $146 billion with four months of the year remaining, more than triple all of last year. Follow-on offerings are up by two-thirds [10].
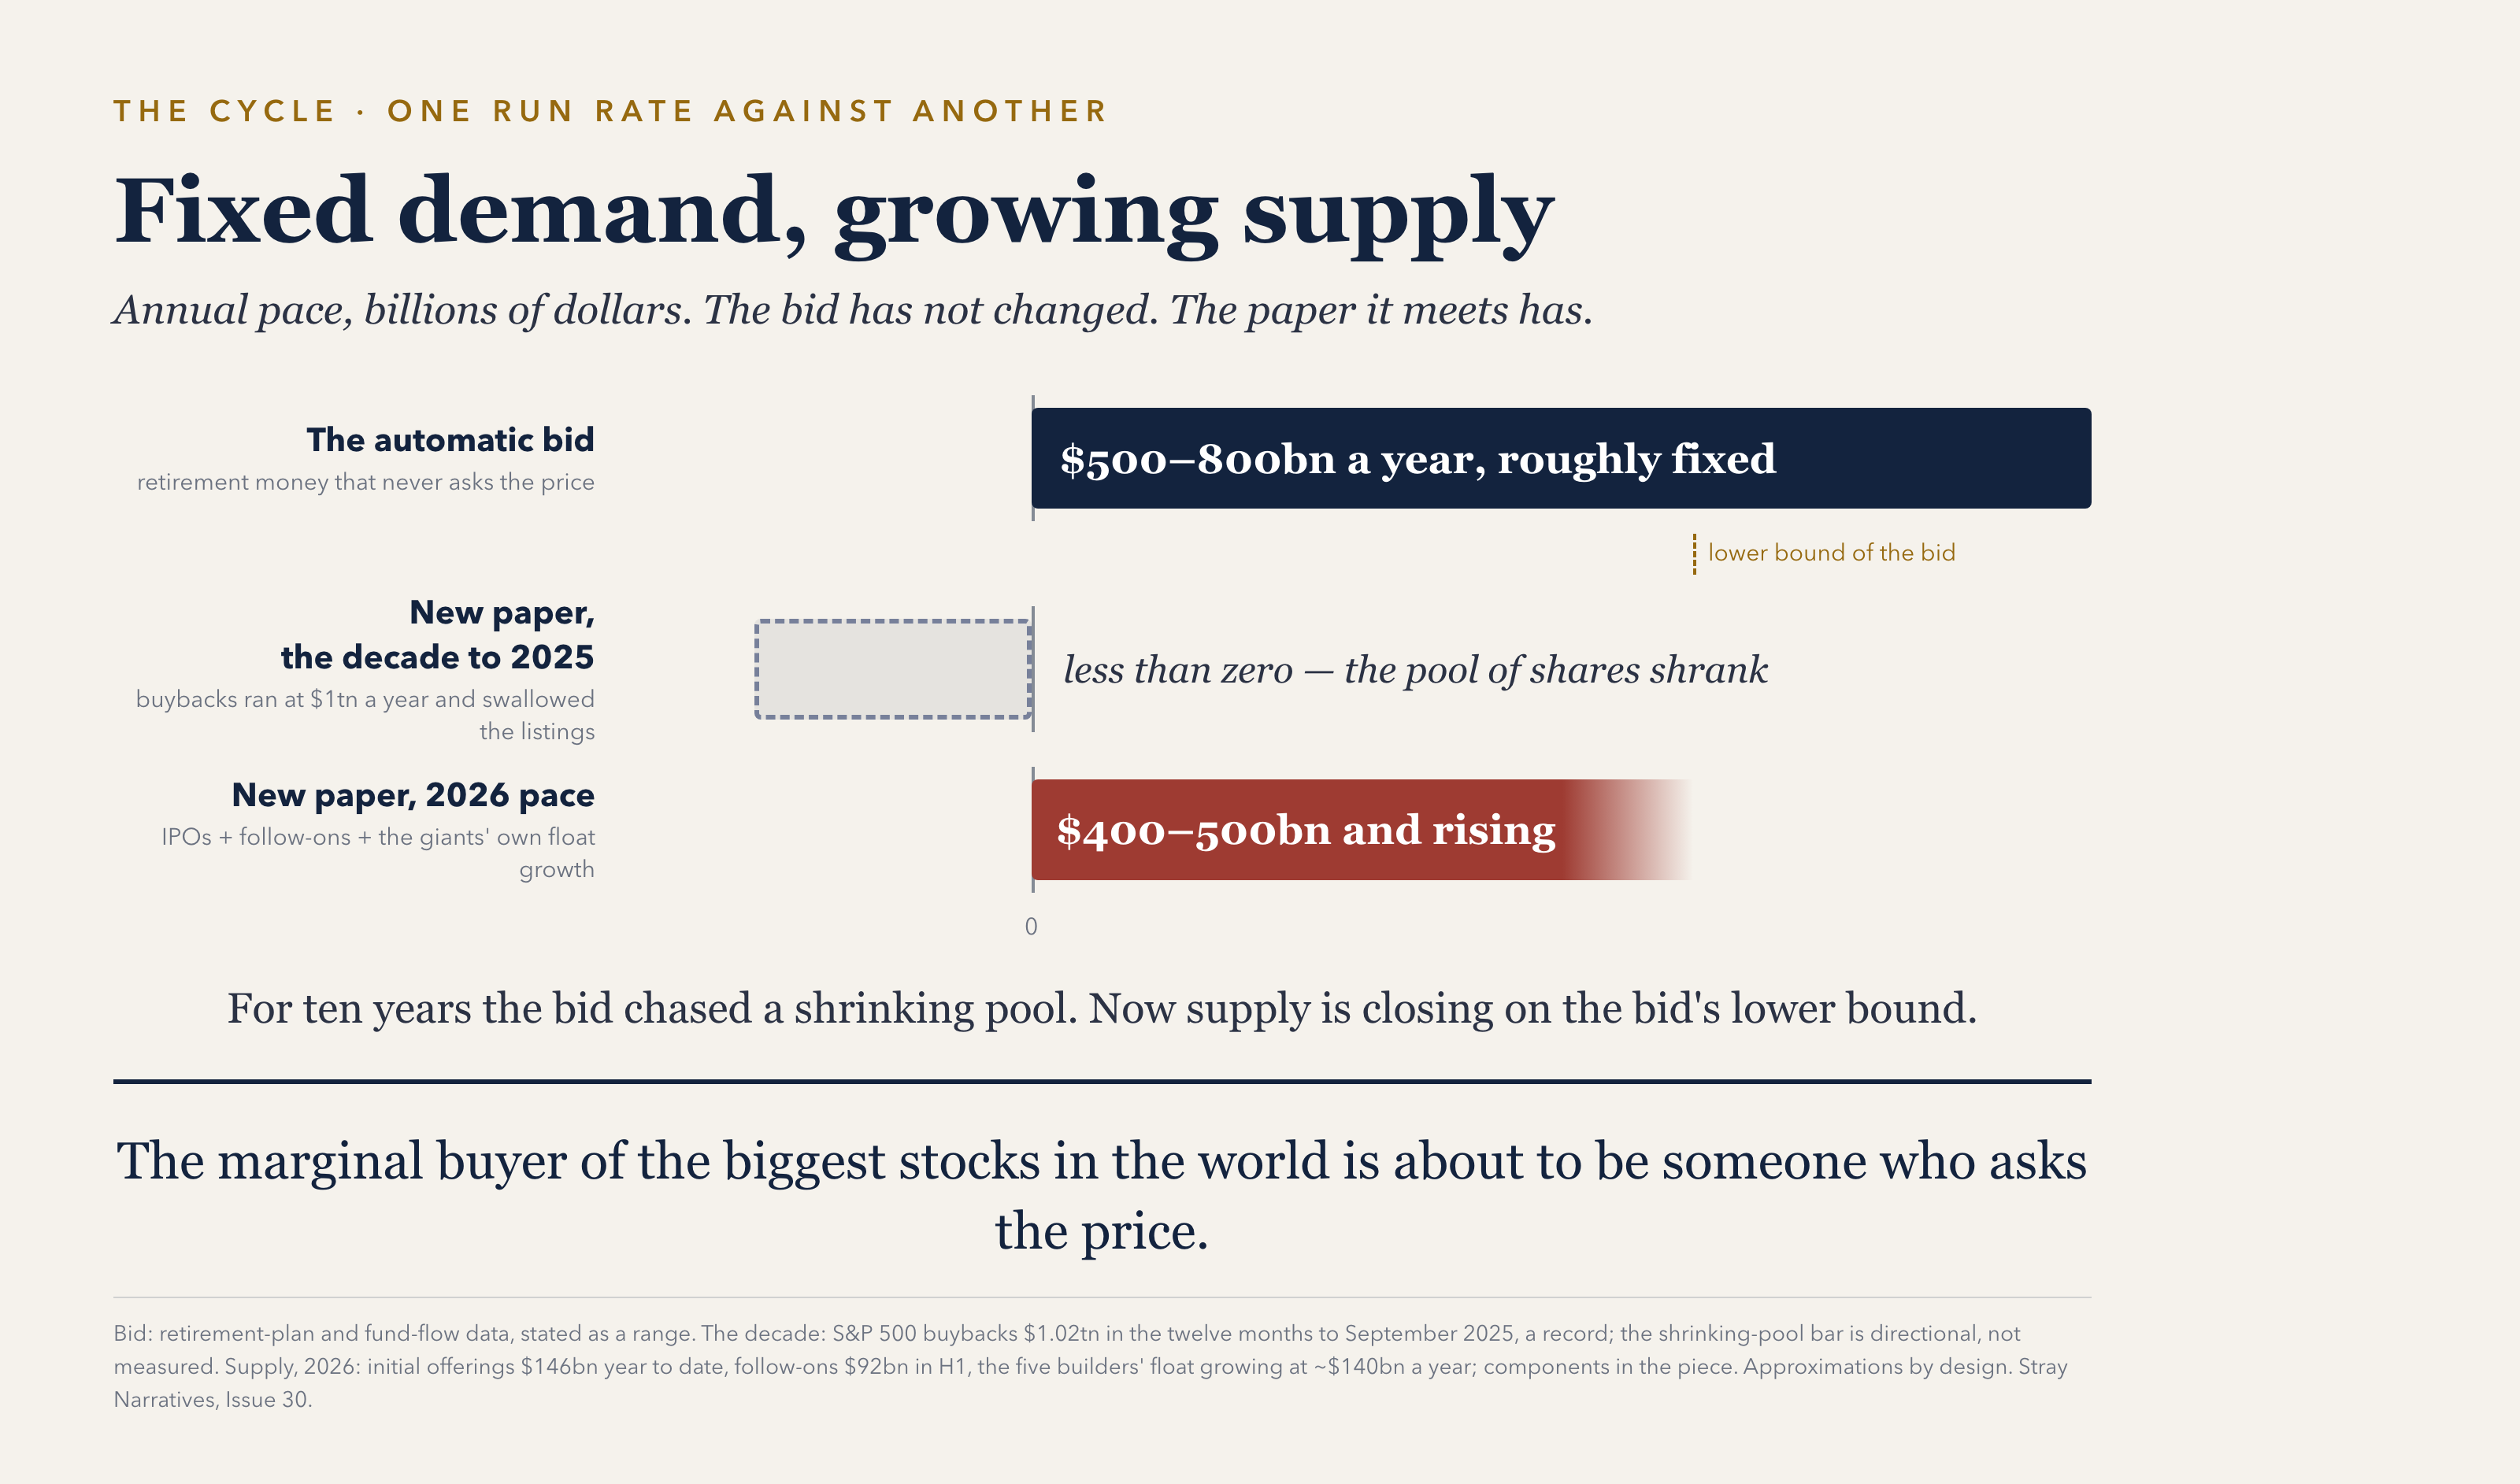
Set the two sides against each other. The automatic bid: roughly $500 to 800 billion a year, held there by payrolls [7]. The supply now meeting it: initial offerings near $146 billion already this year, follow-ons at $92 billion in the first half, the giants’ own float growing at a $140 billion yearly pace [8][10]. Gross new supply is running on the order of $400 to 500 billion a year, already closing on the lower bound of the bid. The trillion-dollar absorber that used to soak up supply has lost its largest engines exactly as issuance triples [12]. Both blades of the scissors are moving, in the same direction, at the same time:
You have seen this movie
In 1919 a company was formed to own the future of communication, and for a decade it did. RCA controlled radio the way today’s giants control computing. The technology delivered everything promised: by the end of the twenties, radio was spreading through millions of American homes, remaking news, entertainment, politics, everything it touched. RCA became the most actively traded stock on the New York exchange. In September 1929 it peaked around $114. Three years later it traded near $2.50, down 98%, while the number of radios in American homes kept growing [4]. The technology never stopped winning. The shares never durably saw their 1929 price again for decades.
That is not a story about radio. It is the recurring shape of every transformative technology, documented across two centuries in Alasdair Nairn’s history Engines That Move Markets [1]. Britain built the world’s densest railway network while the shareholders of 1845 lost most of their money, with railway investment at the peak near 7% of GDP [2]. Electricity conquered the world while Edison lost control of his own company in the 1892 merger that created General Electric [3]. Seven hundred American car makers became a handful [5]. The engine wins. The financiers of its deployment mostly lose. And the mechanism is always the same: the deployment is paid for by selling paper into peak enthusiasm, until the paper outruns the enthusiasm.
For a decade this boom looked like the exception, because its giants bought paper back instead of selling it, but that is no longer the case.
The 2008 rhyme, and the difference
Readers with long memories will hear another echo, this one from 2008. The financing looks familiar. The location of the risk does not, and that second point matters more.
The familiar part first. In 2006, lenders financed the buyers of their own product, and the same house was counted at every link of a securitisation chain. Today the chip and cloud sellers finance their own customers, and the same promised dollar of computing shows up three times: in one company’s backlog, in another’s guarantee, in a third’s valuation. The obligations carried dates then too. Roughly a trillion dollars of adjustable mortgages were scheduled to reset across 2007 and 2008, at $30 to 40 billion a month at the peak, and everyone could see the schedule [13]. The computing contracts signed in 2025 and 2026 begin billing in 2027 and 2028; the one start date actually written in a filing is 2028 [14]. In both cases the bills were visible years in advance, and ignored while everything still looked healthy.
Now the difference. In 2008 the risk sat inside the banking system. The five big investment banks ran leverage as high as forty to one. Bear Stearns carried $11.8 billion of equity against $383.6 billion of liabilities, and borrowed as much as $70 billion overnight, inside a $13 trillion shadow-banking system [15]. A 3% move in the collateral could wipe out a firm’s equity. When it moved, the payment system seized.
Today’s borrowers are investment-grade industrial companies carrying $565 billion of cash and short-term investments between them [8]. Microsoft still holds the triple-A rating it has held since 2008. When these bets go wrong, the losses land on shareholders and bondholders, not on the plumbing that clears everyone’s payroll. The banks are middlemen this time, not warehouses. They originate data-centre loans and pass them onward, and their direct lending to the sector is measured in tens of billions, not trillions [16]. That is why I expect this cycle to end by deflating rather than seizing. The next piece in this series examines how.
One caveat. Moving the risk out of the banks does not move it out of the system. The fastest-growing lender to this boom is private credit, a pool of $1.5 to 2 trillion. The Financial Stability Board, citing private-sector research, expects it to fund roughly $800 billion of AI infrastructure by 2028, financed increasingly by retail vehicles and by insurers that private-equity firms own [18]. That changes how fast an accident spreads and how far it reaches but it does not change the arithmetic.
So: can the bid clear it?
So far, yes, and that cuts against the doom-mongers. Every raise has filled. SpaceX priced and rose. Alphabet’s offering was taken. Alibaba’s book was reported three times covered [10]. The bid has cleared everything thrown at it.
But read what the machine is now being asked to do. The automatic bid is roughly fixed; payrolls and demographics do not care about excitement. The supply meeting it has swung by hundreds of billions a year and is scheduled to grow: the share programmes drawing quietly, the bond calendars, the listing queue. The race is not about any single raise. It is one run rate against another: supply growing toward a bid that payrolls hold roughly fixed. Scarcity has already ended, and for the first time in a decade the marginal buyer of the biggest stocks in the world will have to be someone who may ask the price.
That is how this boom is the same as every boom before it. The railway, the dynamo, the radio and the car all reached this exact moment: the technology proven, the enthusiasm intact, and the paper beginning to flow. From roughly this point on, the engines kept winning and their financiers started losing. The buyer’s largest engines have left the market they made. The paper is flowing. The next few quarters will answer it: can the bid clear it.
Buyback, issuance, capex and cash figures are from company filings, cross-checked against regulatory data; where a figure rests on press reporting it is labelled as such. The bid estimate is built from retirement-plan and fund-flow filings and is stated as a range. Sources below:
References
Alasdair Nairn, “Engines That Move Markets: Technology Investing from Railroads to the Internet and Beyond,” 2nd edition, Harriman House, 2018. The historical figures below are carried on independent sources, not the book.
Railway Mania: A. Odlyzko’s academic work on 1840s railway investment (~7% of UK GDP at peak); Campbell and Turner, financial-history studies
Formation of General Electric, 1892: standard corporate history
RCA share price 1929–1932: contemporaneous NYSE records via standard market histories
S. Klepper, entry and exit studies of the US automobile industry
Megacap buyback series 2021–2025: company cash-flow statements via SEC filings and market data services
The bid estimate: US Department of Labor Form 5500 (retirement-plan contributions, ~$652bn 2024); Investment Company Institute retirement and fund-flow data; index weights per S&P 500 constituent data. Stated as a range; components not summed where they overlap
Q1 and Q2 2026 Forms 10-Q (Microsoft, Amazon, Alphabet, Meta), FY2026 Form 10-K (Oracle), and NVIDIA’s Form 10-Q for the half to 26 July 2026 ($39.0bn of repurchases): repurchase, issuance, stock-compensation, capex and operating-cash-flow lines via SEC XBRL as filed. Amazon and Meta debt issuance per the filings; the Alphabet and Oracle debt-change lines and the cash-and-short-term-investments aggregate are market data (EODHD), pending filing tags
Alphabet Forms 8-K and pricing prospectuses, June 2026 ($18bn common + $16.75bn mandatory convertibles + $10bn placement + $40bn at-the-market programme); Meta Form 424B2, May 2026 ($25bn notes); Oracle financing-plan release and prospectus supplement ($25bn bonds, $20bn ATM); Alibaba Form 6-K, August 2026 ($10.2bn placement); Nebius Forms 6-K ($5.75bn convertibles); CoreWeave releases (>$20bn of 2026 facilities and notes)
Renaissance Capital, US IPO market reviews, 2026 (SpaceX $75bn at $1.7tn, +19% day one; YTD proceeds $145.8bn) and H1 follow-on totals per ECM reviews — specialist and press-grade throughout; Alibaba book coverage per Bloomberg
OpenAI, announcement of confidential draft S-1 submission, 22 May 2026 (primary for the fact of filing). Anthropic listing preparations: press reports, unconfirmed by the company
S&P Dow Jones Indices, quarterly buyback release, December 2025: $249.0bn for Q3 2025; record $1.020tn for the twelve months to September 2025. No later release located at source as of writing
Financial Crisis Inquiry Commission, Final Report (2011): subprime originations $600bn in 2006 (23.5% of all originations); private-label securitisation
($1tn across 2007–08, $30–40bn/month peak): the contemporaneous Credit Suisse schedule, reprinted by the IMF; press-canonicalNVIDIA Corporation, Form 8-K, 17 August 2026: lease obligations “expected beginning in 2028.” The billing mechanics are treated in the next piece in this series
FCIC Final Report: broker-dealer leverage up to 40:1; Bear Stearns equity and liabilities; the $13tn shadow-banking system
Federal Reserve, Financial Stability Report, May 2026 (bank commitments to nonbank financials $2.6tn; no data-centre lending quantification); bank data-centre lending and syndication figures: press reports of industry data
S&P Global Ratings: Oracle downgraded to BBB− (from BBB, negative outlook), outlook stable, July 2026; Moody’s Baa2 negative via press; Meta prospectus ratings disclosure; Moody’s sector warning, July 2026, via press
Financial Stability Board, “Vulnerabilities in Private Credit,” May 2026 (global private credit $1.5–2tn; ~$800bn projected into AI infrastructure by 2028, citing private-sector research); Federal Reserve FSR Box 4.1 (US private credit ~$1.4tn; semi-liquid retail vehicles); NAIC (private-equity-owned insurers’ invested assets $704.3bn)