

Stray Narratives is published when the market demands a closer look. Nothing in this publication constitutes investment advice. All views are those of the author. Please read our full disclaimer. As always, please share this post if you enjoy it, that’s how it stays free!
The Short Version: We are entering a tactical seven-month window in the AI cycle. On one side, hyperscaler capital spending is still accelerating; on the other, the first cracks in how that spending gets funded are starting to show. History says the first funding scare is a canary, not the crash—and as near-term financing rounds clear over the next two quarters, AI hardware faces one more sprint before a massive wall of insider lock-up expirations and new share supply hits in May and June 2027. I bought SK Hynix at 1,200,000 won, 60% below its June high [1]. Three scenarios run from −36% to +61%, with a 15% stop at 1,020,000 won.
The Market Outlook: Capex Is Climbing, the Funding Pipes Are Groaning
In AI Needs Over $3 Trillion and The Companies Selling AI Are Paying for It. For Now., I argued that the AI infrastructure boom draws on four sources of funding, each with a hard limit, and that the sequence eventually ends in a bust [2].
I have not changed my mind about how the movie ends. What matters for the next two quarters is which scene the market is in right now.
Look at the physical build-out: the biggest buyers are still pressing the accelerator to the floor.
Meta spent $34.9 billion on capital expenditures in the third quarter—up 80% from a year ago—and lifted the bottom end of its full-year 2026 capex guidance to a range of $135 billion to $145 billion (from $130 billion to $145 billion). With $85.8 billion spent through the first nine months, simple subtraction implies Meta will spend $49 billion to $59 billion in the fourth quarter alone—a 41% to 70% surge over the third quarter in a single three-month sprint (it gave no 2027 figure) [3].
TSMC, the world’s dominant contract manufacturer of AI chips, raised its 2026 revenue growth forecast on October 15 to roughly 44% in US dollars, up from slightly above 40% in July [4].
Micron told investors that memory-chip supply conditions will remain tight through 2027 and 2028, while boosting its own capital spending to build future capacity [5].
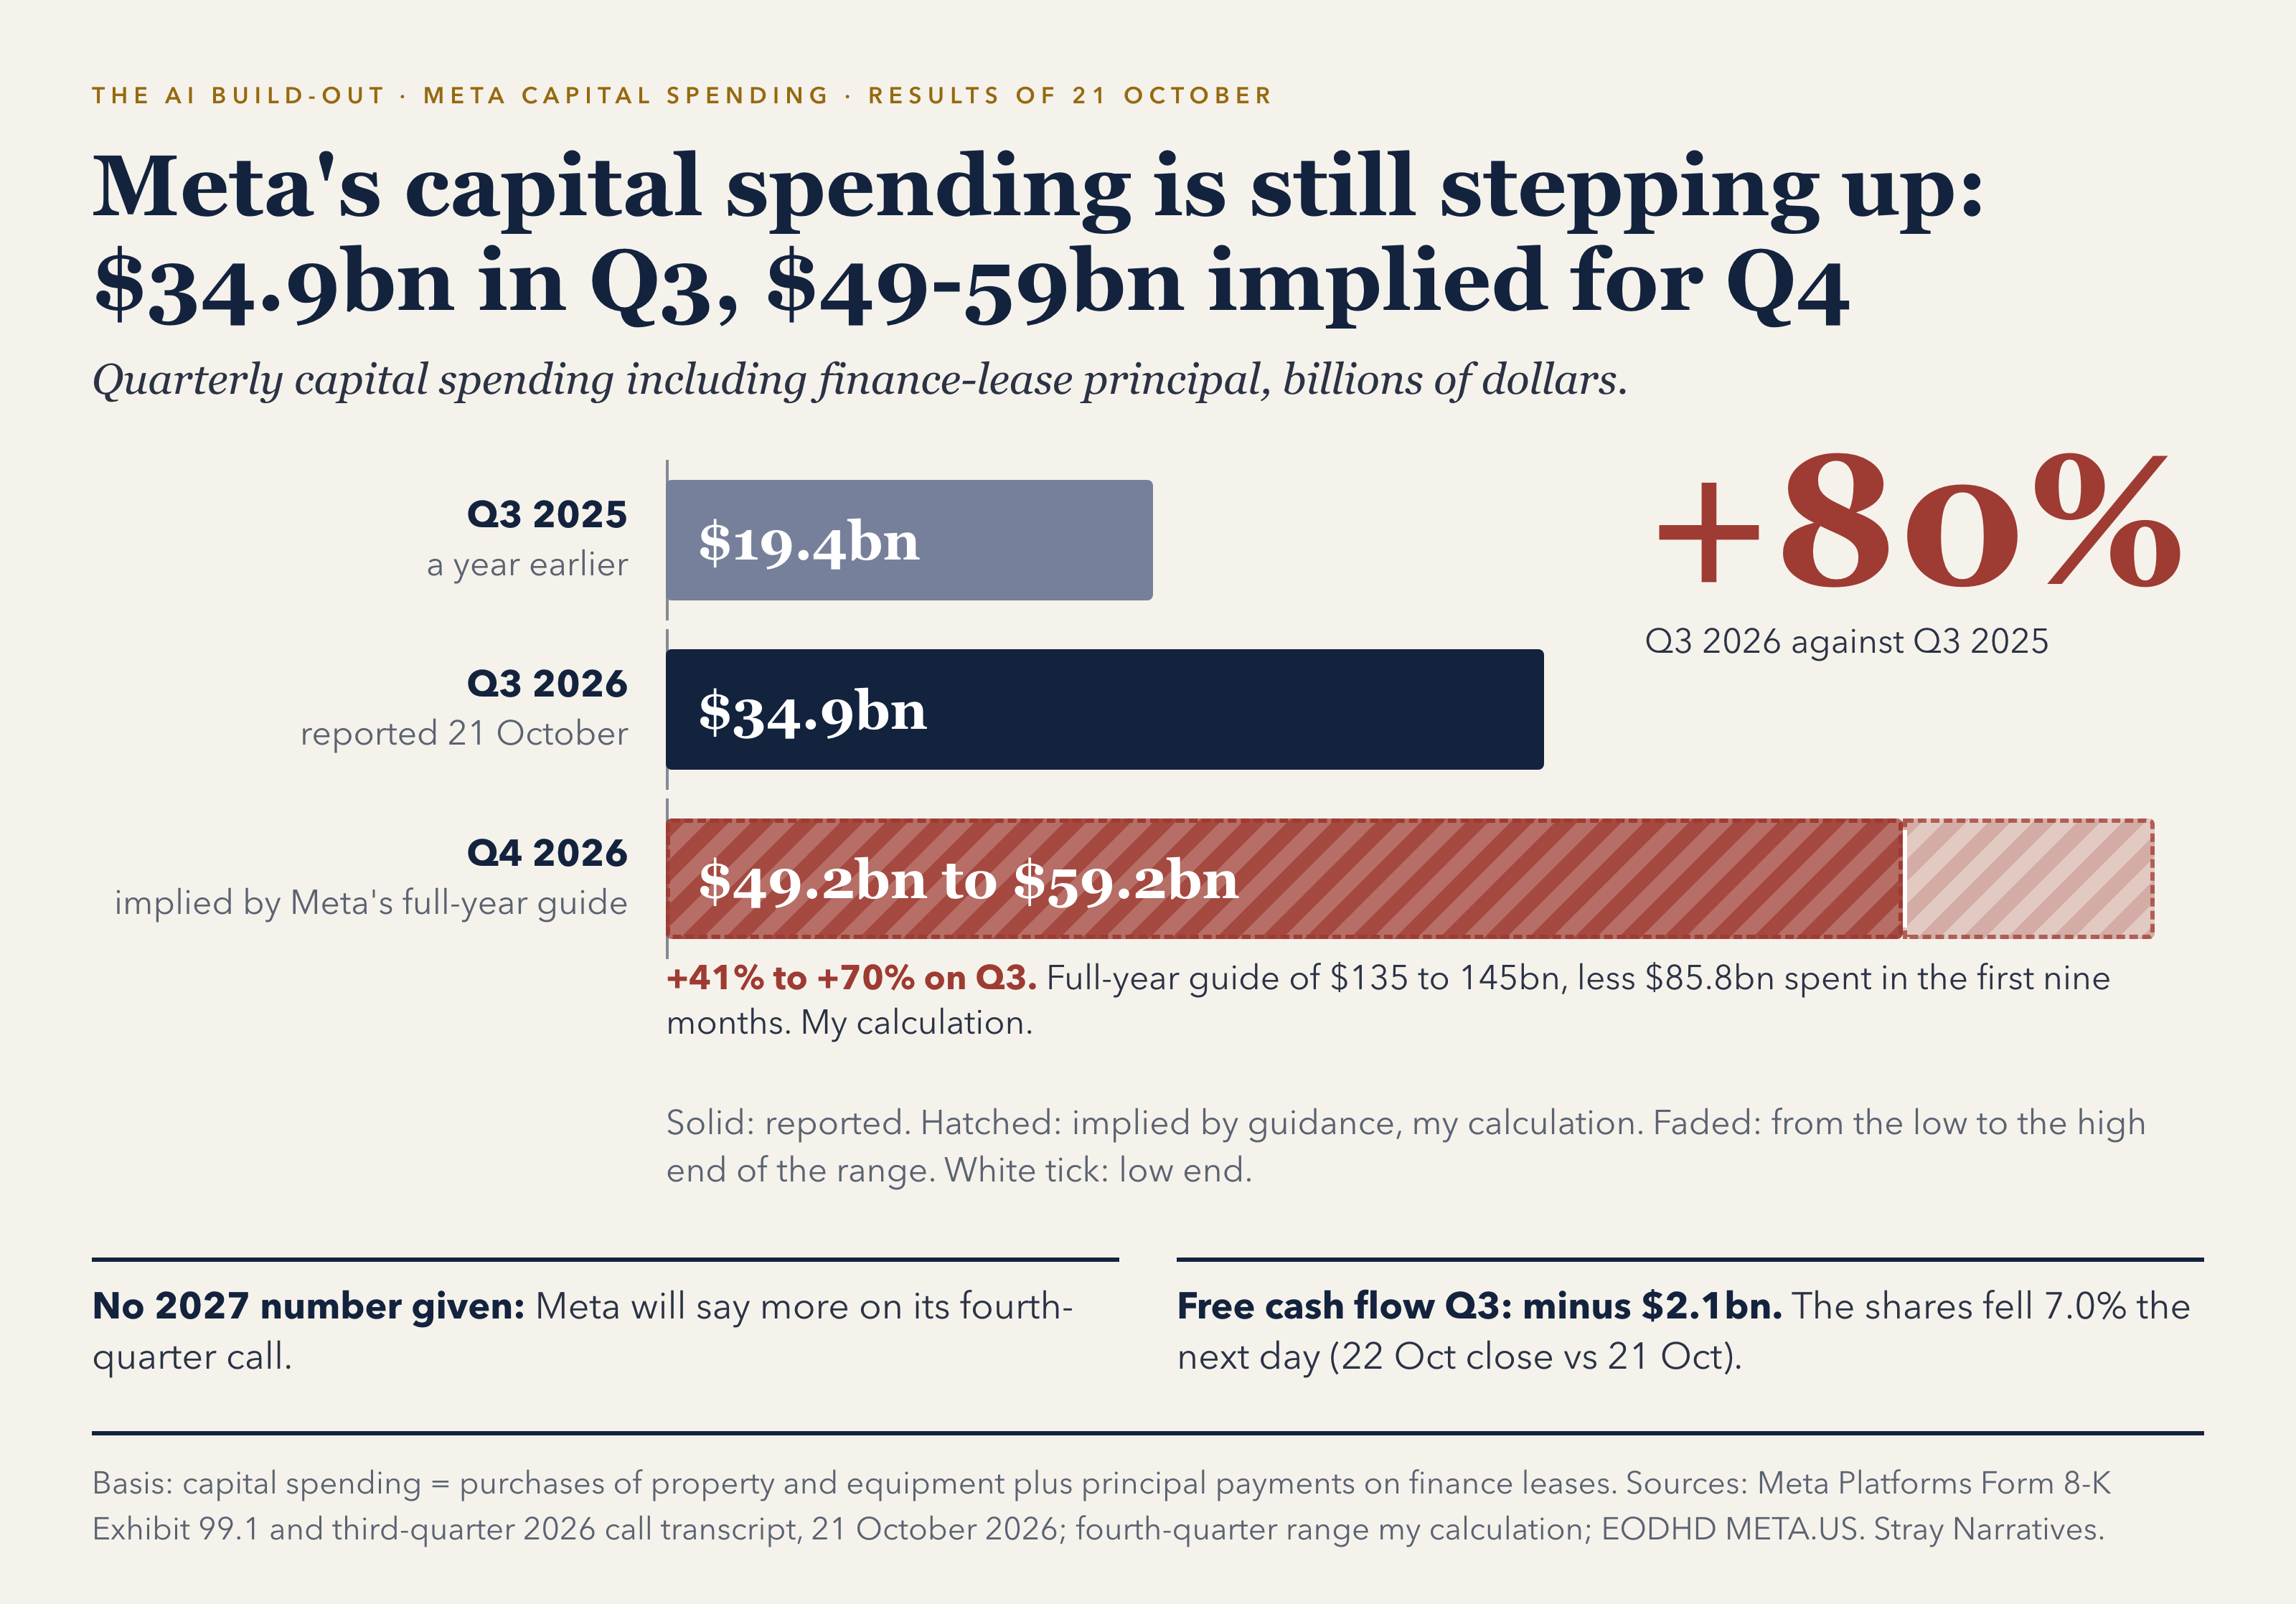
Yet the stock market is suddenly refusing to cheer the spending. On October 15—the very day TSMC raised its growth guidance—SK hynix opened 8.1% lower and finished the day down 11.1% [1][4]. On October 22, Meta shares dropped 7.0% after reporting that its massive capex bill had pushed third-quarter free cash flow into the red at minus $2.1 billion [1][3].
The orders are still booming, so why are the stocks wobbling? Because investors are starting to ask who is going to pay the bill.
Wednesday, buried in a preliminary shareholder information statement (Schedule 14C) to create a new class of non-voting stock, Meta admitted that it expects to raise outside capital, including issuing new equity, to fund its AI ambitions [6]. Even more striking was the board committee’s reasoning: timing is critical because rivals—explicitly naming Alphabet, SpaceX, Anthropic, and OpenAI—are soaking up the market’s available capital. The filing also noted tightening credit conditions for mega-cap tech borrowers and weaker-than-normal demand for a July bond issue tied to Meta’s Texas data-center joint venture [6]. (Meta added that it has sufficient capital for its immediate needs, and gave no size or date for a stock sale.)
The Canary and the Cliff: Why a Seven-Month Window Just Opened
When the richest companies on Earth warn that credit is tightening and they need to sell stock to keep buying GPUs, is it time to head for the bunkers?
Not yet. I read Meta’s filing as the canary in the coal mine, not the crash—and in late-cycle markets, some of the most violent rallies may still happen in the last inning.
Rewind to March 2008. During the week of March 10, Bear Stearns ran out of funding—its liquidity pool evaporated from $18 billion to $2 billion in seventy-two hours—and on March 16 it was forced into a fire-sale rescue by JPMorgan [7]. Bear Stearns was the unmistakable proof that the credit cycle had broken. Yet what happened next? Once the immediate funding panic cleared, from March 14 through mid-May 2008, the S&P 500 rallied 10.8% and the Philadelphia Semiconductor Index ripped 24.5% higher [1][7]. The real crash didn’t arrive until Lehman Brothers failed on September 15, after which semiconductors plunged 59% from their May peak [1][7].
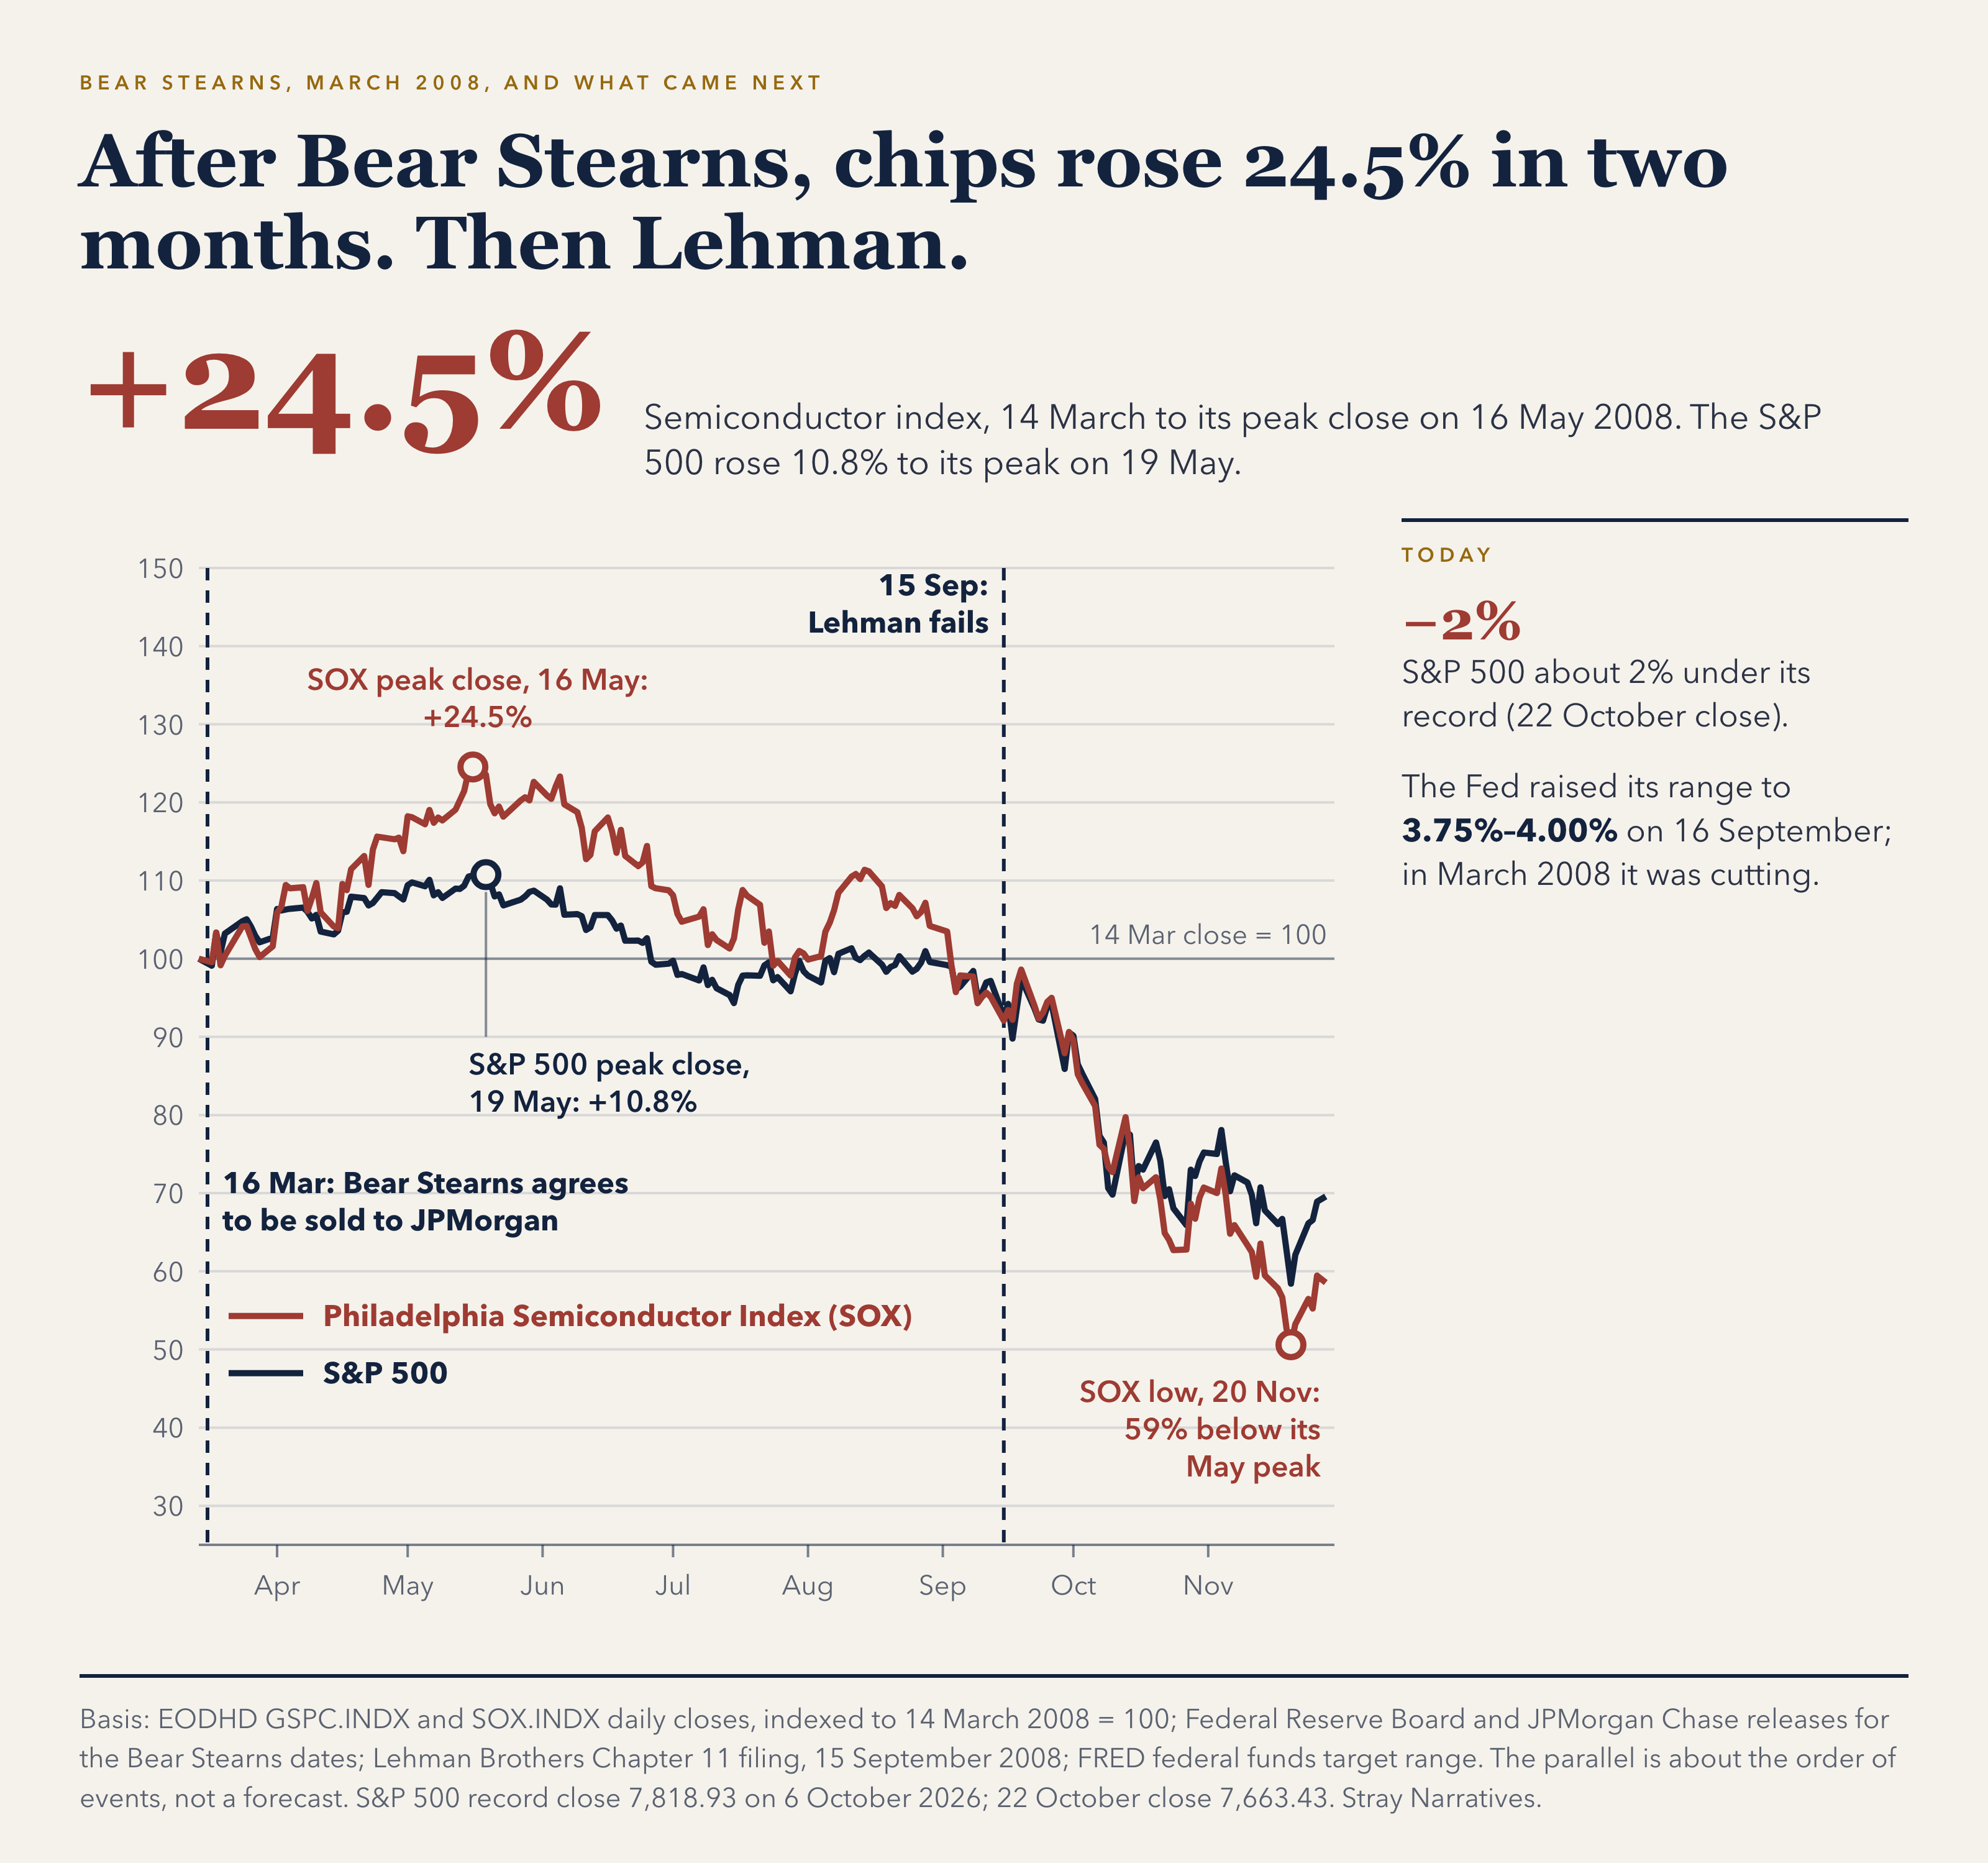
Today’s setup rhymes with March 2008, with two cushions and one caveat:
The Cushions: Unlike Bear Stearns, Meta is sitting on $82.4 billion in cash and marketable securities [3], and the broader S&P 500 is sitting just ~2% below its all-time record, meaning the stress is localized inside the AI funding chain rather than systemic [1]. The players most exposed to a funding freeze are standalone AI model labs and leveraged compute-rental firms, not Meta.
The Caveat: In March 2008, the Federal Reserve was aggressively cutting interest rates. In this cycle, the Fed raised its target range by 25 basis points to 3.75%–4.00% on September 16 [8].
Mapping the Window (Now Through Mid-May 2027)
On October 19, Willow Lake Research laid out the bull case for a melt-up into mid-2027 [9]. The report noted that while semiconductor earnings estimates have climbed since June, valuations have fallen—a sign the market is already bracing for a miss. Its author expects three major financing overhangs—an Anthropic share sale, the close of OpenAI’s funding round, and a new credit facility for CoreWeave—to clear before the end of March, making Q1 2027 the final quarter where corporate share buybacks outpace new equity supply. After that, the report argues, a wave of IPOs and insider lock-up expirations between May 17 and June 12, 2027 will overwhelm buyers. Its call: trade the rally up to the lock-ups, and get out before they hit [9].
Does new share supply actually swamp the market’s buying power in 2027? Here is my own supply-and-demand math:
The Structural Bid ($500B to $800B/year): In The Largest Buyer Just Left, I estimated the steady, price-insensitive buying from retirement plans and index funds at $500 billion to $800 billion a year [10]. For a decade through 2025, corporate buybacks retired more stock than IPOs created [10].
2026 Supply (~$400B pace): In that earlier issue, I estimated 2026 equity supply—IPOs, follow-on offerings, and net share issuance (including employee stock pay) across the five largest AI builders—at $400 billion to $500 billion. (Alphabet’s June capital raise was inadvertently counted in two separate lines; counted once, the true 2026 pace is about $400 billion [10].)
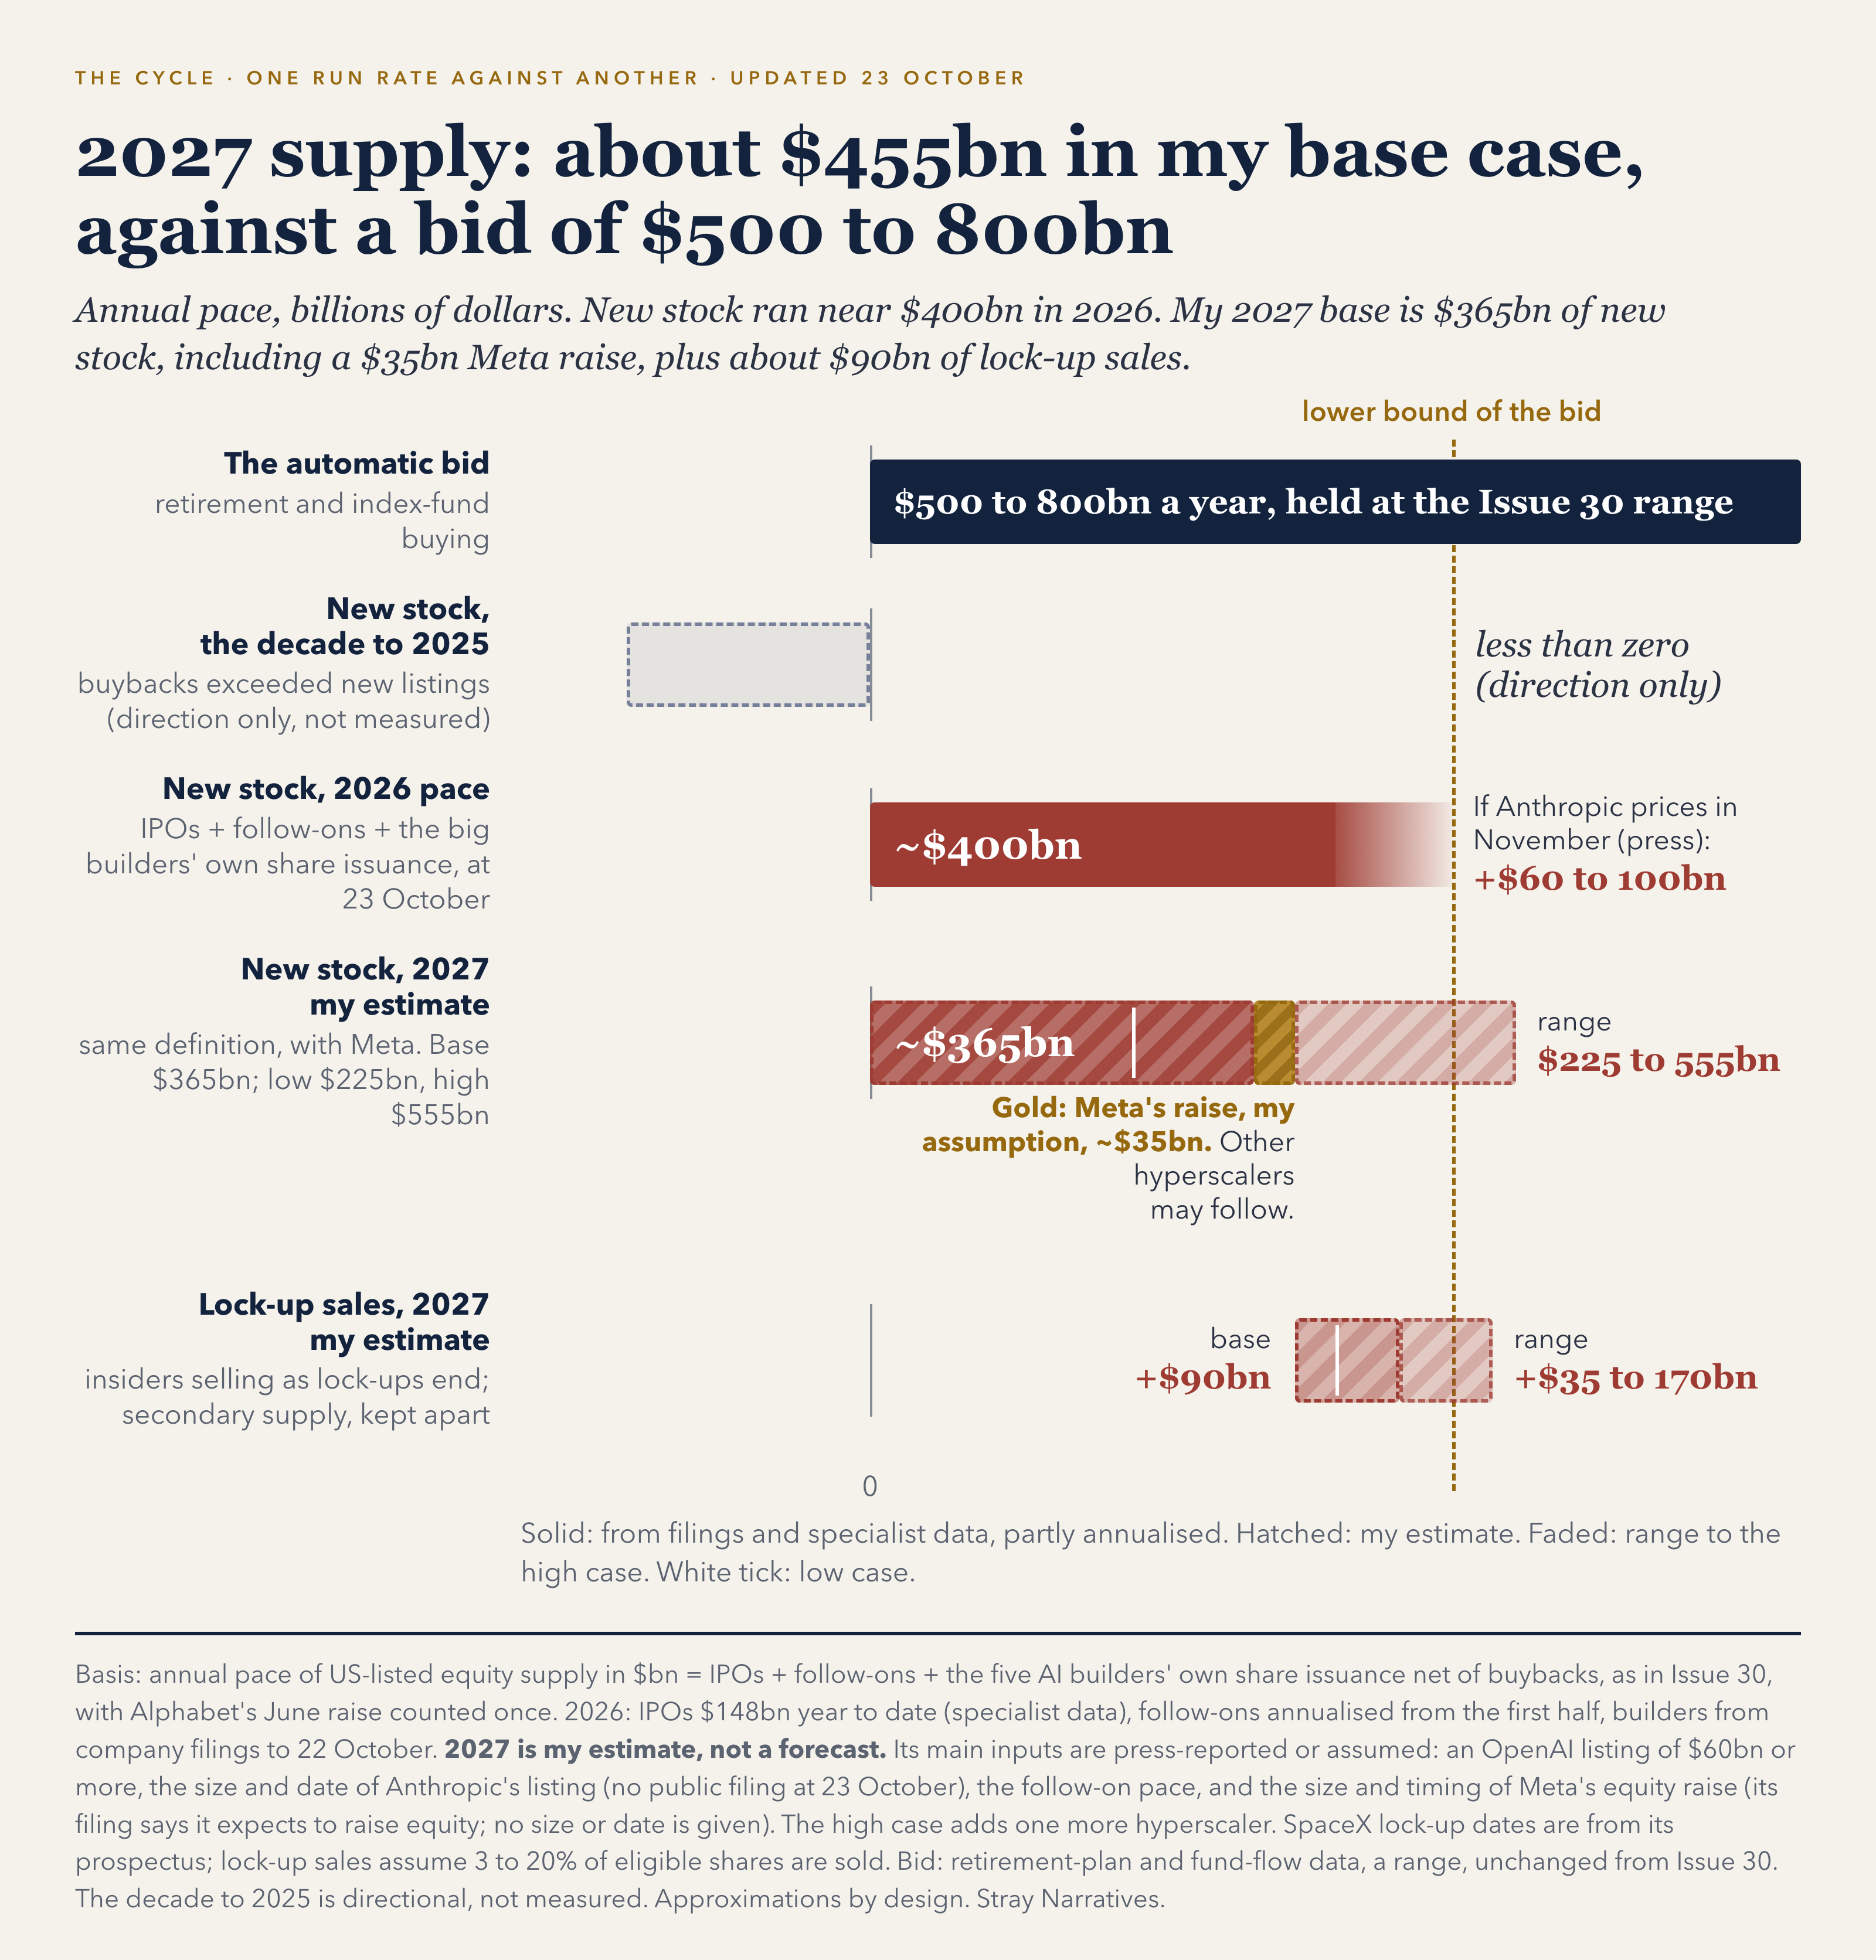
Updated 23 October. Solid bars are 2026 figures from filings and specialist data, partly annualised. Hatched bars are my estimate. The range is low to high.
2027 Supply ($455B Base Case / $725B High Case): For 2027, my base case models $365 billion in new stock issuance (range: $225B to $555B) plus $90 billion in insider lock-up sales (range: $35B to $170B, assuming insiders sell 8% to 10% of unlocked shares within a 3% to 20% band; at the Willow Lake author’s 25% sell-through assumption, lock-up sales hit $260 billion) [11]. That brings total 2027 supply to $455 billion—just $45 billion below the floor of the retirement bid, well inside my margin of error, while my high case ($725 billion) blows right past the floor.
Where the 2027 Supply Comes From: My figures assume Anthropic lists in November 2026 (adding $60 billion to $100 billion of extra 2026 supply per press reports, though no SEC filing existed as of October 23 [11][12]) and OpenAI lists in 2027. I also include $35 billion from Meta (range: $15B to $70B; scaled to Meta’s size, Alphabet’s June financing of ~1.1% of market cap equals ~$20B). Meta’s new non-voting share class goes live on January 19, 2027, with trading expected in late January, and I put 40% odds on Meta tapping the market between January 19 and March 31 [3][11]. My high case adds another $25 billion for a copycat hyperscaler—most likely Oracle, which has exhausted its existing share-sale authorization [11].
Crucially, annual averages hide quarterly traffic jams. While 2027 flows look roughly balanced across twelve months, the lock-up expirations cluster tightly in May and June 2027.
That creates my seven-month window: near-term funding fears clear in Q4 and Q1, hyperscaler capex checks keep flowing into memory chips, and a supply wall arrives in May 2027.
Why SK Hynix Is the Best Vehicle (And Where My Toll Thesis Stands)
In I Am Buying the Business That Sells Time, I bought SK hynix at 1,504,000 won, and in The Crash Hedge That Pays You to Wait, I sold it at the Seoul open on September 7 at 1,737,000 won for a 15.5% gain. I made money because AI memory demand was ferocious. The structural thesis behind it was the toll case: long-term volume commitments with a price that still moves with the market. SK hynix said on July 29 (Seoul time) that it has concluded long-term agreements with around ten customers [13]. On its earnings call it said the term is normally around five years, that the agreements include long-term volume commitments and deposits, and that pricing varies by customer and product and is designed to address price volatility [13]. It has not said whether any price is fixed, floored or capped, how large the deposits are, or what share of sales the agreements cover. I wrote in August that contracted volume with open pricing makes it a toll.
The company’s half-year filing on DART, which covers the period to June 30, says it sets volume and price by monthly or quarterly agreement and has no order backlog under long-term supply contracts [14]. That report predates the July agreements, so I cannot see them in the accounts yet. The third-quarter report is the first filing that could show them: contract liabilities well above the KRW 523.5 billion reported at June 30, or a change to the order-status wording [14].
How much of SK hynix’s volume is on contract? The company has not said. I average the two peers that have given a number:
Micron (prepared remarks and 10-K): 26 strategic customer agreements cover more than 35% of revenue through 2030. Three-quarters of that revenue has a defined pricing framework, a majority of which has floors and ceilings. Customers have committed $32 billion, mostly as cash deposits [5].
Samsung (call, not filed): on July 30 it said it plans to put 60% to 70% of its capacity on long-term agreements, with minimum price floors on mainstream products and advance payments [15]. That is a target, not a signed share.
SK hynix (call): around ten customers, terms of normally around five years, deposits included, pricing mechanisms that vary by customer and product [13].
My estimate: Micron’s 35% and Samsung’s midpoint of 65% average to 50%. Using Samsung’s 60% and 70% instead of the midpoint gives 47.5% to 52.5% [15].
The estimate has four weaknesses. Micron’s figure is a share of revenue and a floor. Samsung’s is a capacity target stated on a call. High-bandwidth memory is the product most likely to be contracted: Micron has contracted the vast majority of its 2027 supply of it [5]. If SK hynix sells more of it than Micron or Samsung, the true share is higher. And SK hynix declined to give a share. One Korean broker estimated in July, before the company’s announcement, that about half of revenue was on long-term agreements. That agrees but is not independent evidence [16].
For a tactical seven-month window trade, here is why I choose SK hynix over its peers:
Why not Micron? It has fallen 24% since June 30, against 52% for SK hynix [1]. It has also disclosed more protection: floors and ceilings on part of its contracted revenue, with ceilings on the largest agreements near the second-quarter market price [5]. That cushions a downturn and caps a rebound on that part of its sales.
Why not Samsung? It has fallen 35.5% since June 30 [1]. It trades at roughly 3.2 to 3.3 times its annualized preliminary Q3 operating profit, against about 3.0 times consensus Q3 profit for SK hynix [16]. A share of Samsung also comes diluted with smartphones and a contract chip-foundry business.
Why SK hynix? Unlike Samsung, it is a pure memory business, and the market has marked it down furthest. In a seven-month window where capex is surging, that is the stock with the most to recover.
The Valuation: Fair If the Contracts Are Soft, Cheap If They Hold
On October 23, SK hynix closed at 1,277,000 won—down 57% from its June 25 intraday peak of 2,987,000 won [1]. Meanwhile, its second-quarter operating profit hit KRW 60.5 trillion, beating the KRW 47.2 trillion it earned across all four quarters of 2025 combined [13].
Run the naïve screen math that bargain hunters love, and the stock looks very cheap:
Market Cap (at 1,277,000 won): KRW 930.8 trillion (~US$702 billion), which includes net cash and a stake in a Japanese memory maker, meaning the core memory business is valued even lower [1][14].
Annualized Q2 Operating Profit (×4): KRW 242.2 trillion [13].
Headline Multiple: 3.8 times operating profit (or 7.2 times trailing twelve-month profit of KRW 128.7 trillion) [1][13].
Do not rely on that multiple. Annualizing a single peak quarter is a common error in semiconductor investing. In the second quarter, SK hynix’s operating profit jumped 61% quarter-over-quarter, to a 76% operating margin, against its previous best full-year margin of 51.5% at the 2018 cycle peak [13].
Commodity memory stocks usually look optically cheapest right at the top of the cycle when margins are unsustainably high:
Near the cycle peaks of 2018 and 2022, SK hynix traded at roughly 4 times annualized quarterly profit or more—and then compressed to 2 to 3 times while profits were still near their highs [1][13].
One year after the 2018 peak, in 2019, SK hynix’s operating profit fell 87% [13].
To strip out the peak-margin effect, I value SK hynix on normalized margins. From 2018 through 2025, its revenue-weighted operating margin averaged 28.9% [13]. Most of that memory was priced at the market. If about half of today’s volume is on contracts, I use a blend of two margins:
Contracted half: a 40% operating margin (my assumption; no company publishes its price floors).
Uncontracted half: the 2018–2025 average of 28.9%.
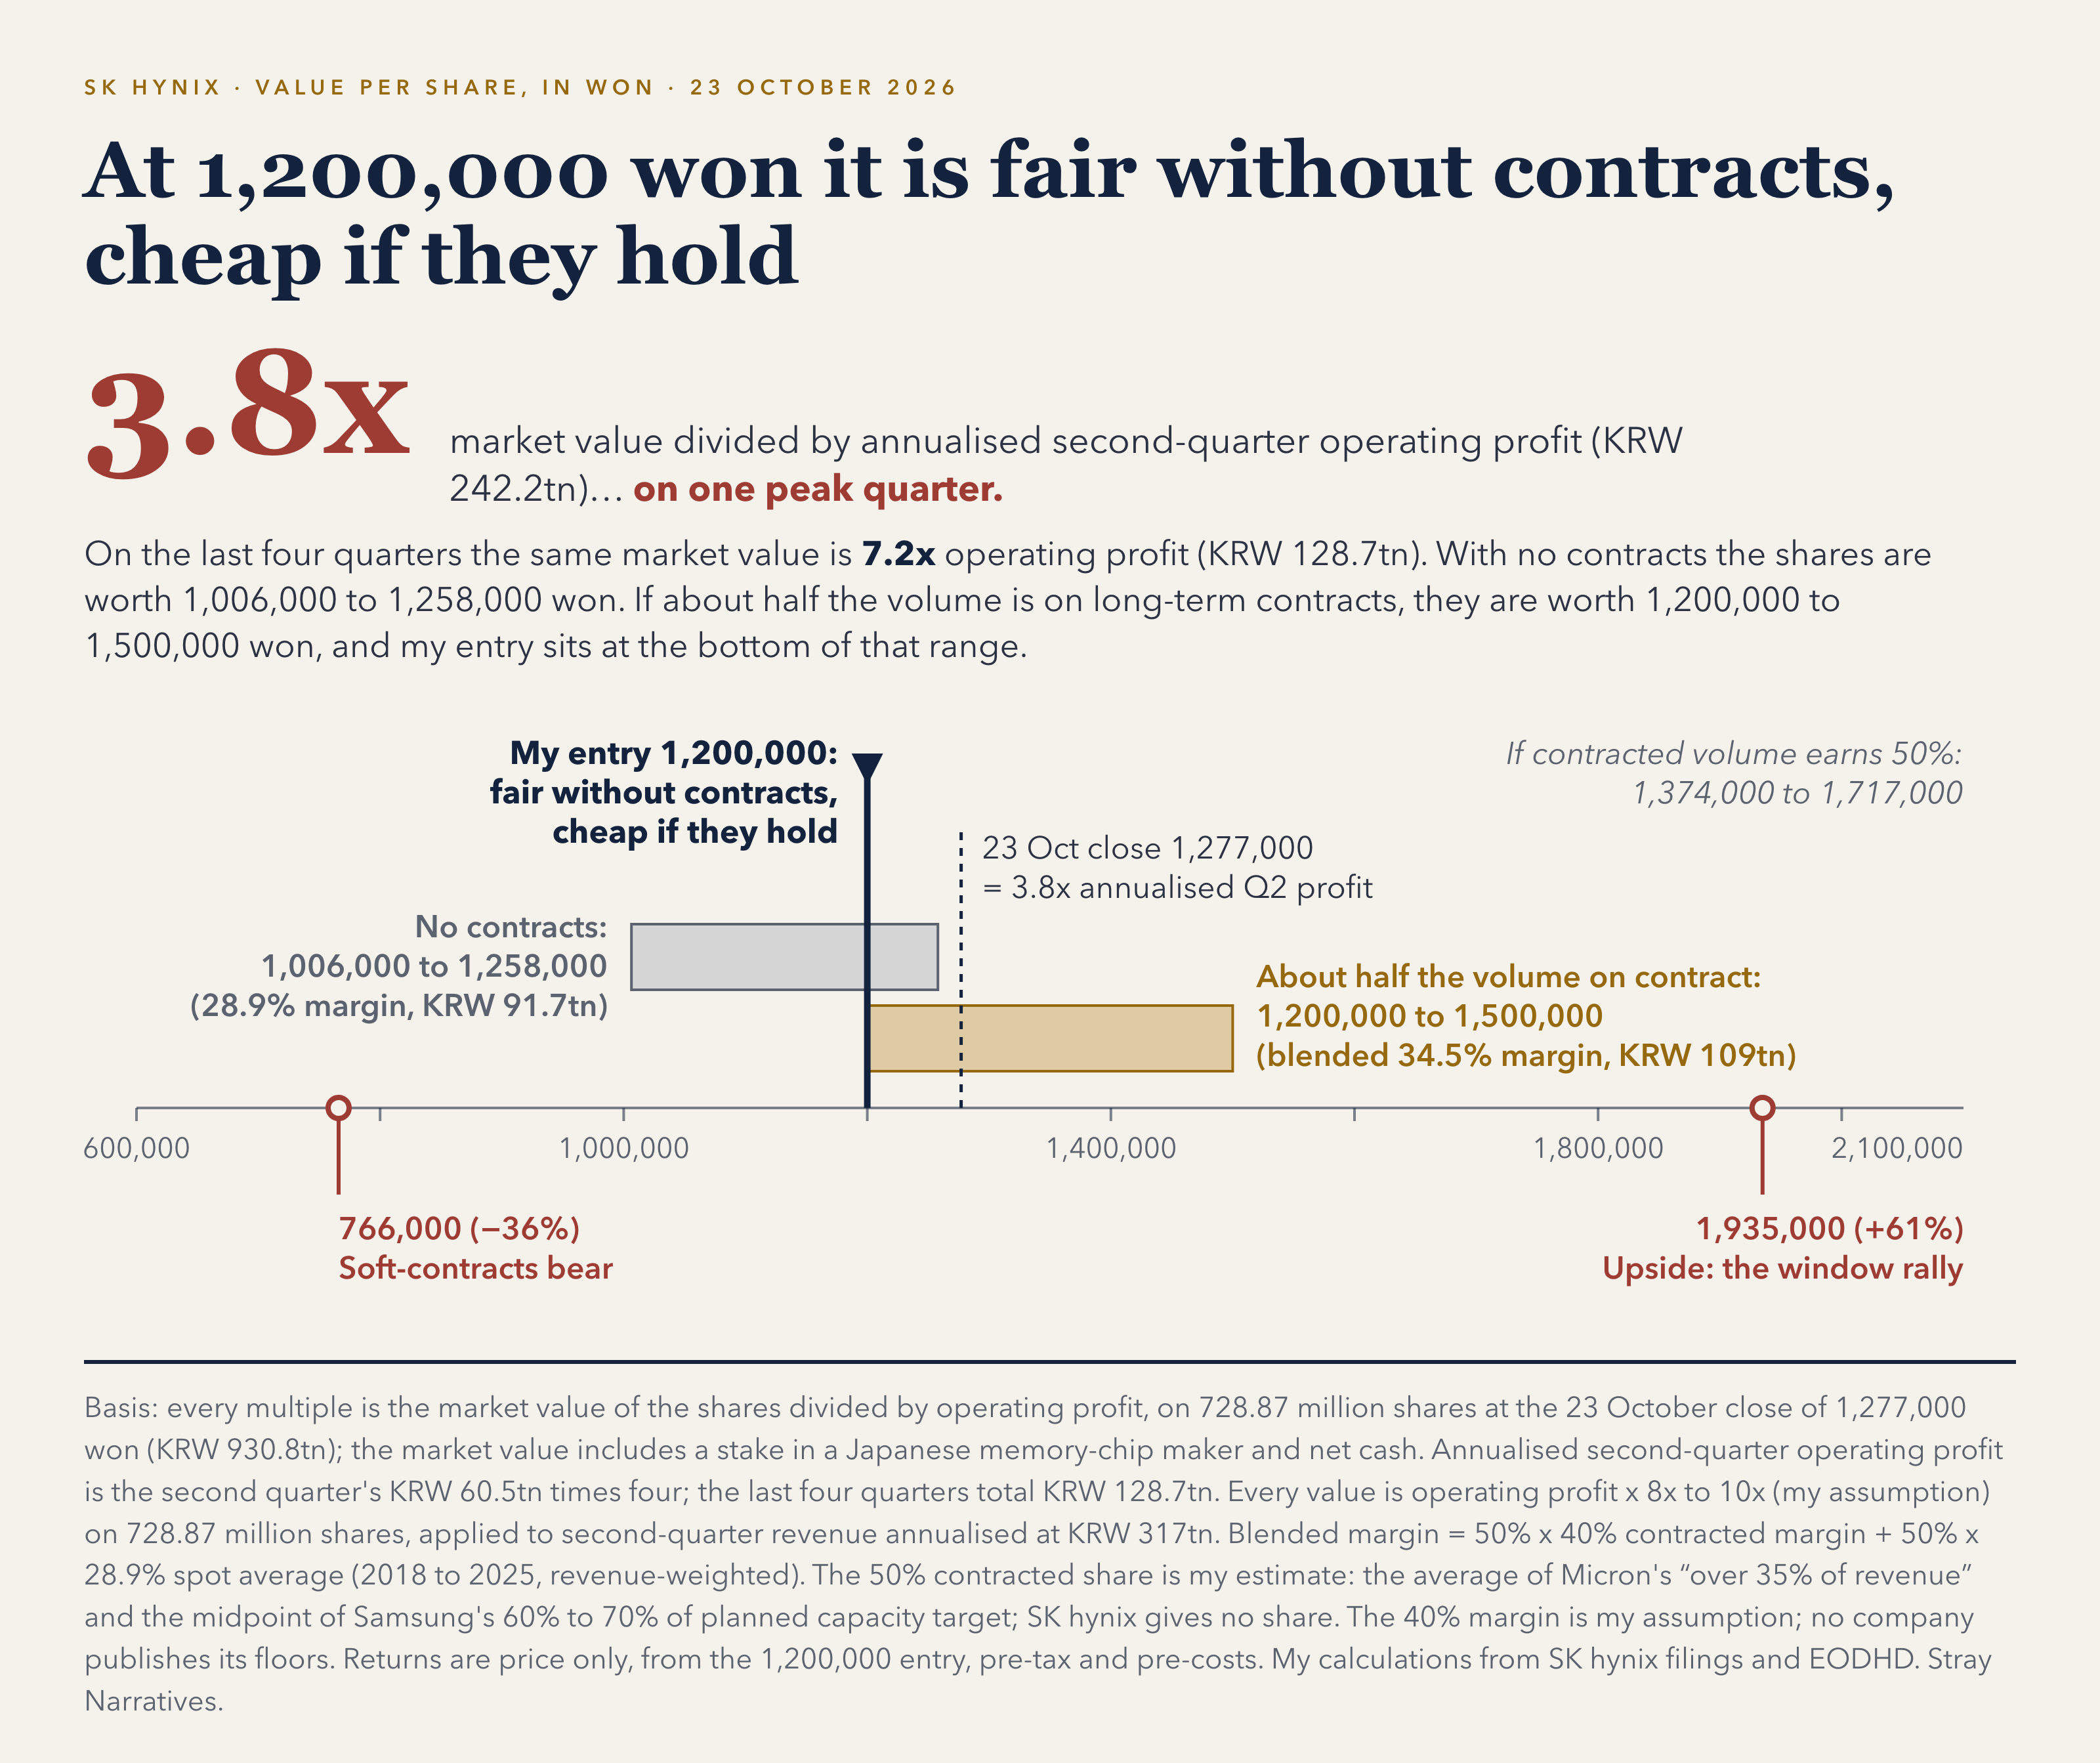
Blend: 50% × 40% + 50% × 28.9% = 34.5%. On second-quarter annualized revenue of KRW 317.3 trillion, normalized operating profit is KRW 109.3 trillion. At 8 to 10 times (my assumption), the stock is worth 1,200,000 to 1,500,000 won.
Sensitivity, if the contracted half earns 50%: the blend is 39.5%, profit KRW 125.2 trillion, and the value 1,374,000 to 1,717,000 won.
Cross-check, if the contracts prove soft and everything earns 28.9%: profit KRW 91.7 trillion, and the value 1,006,000 to 1,258,000 won.
The margin on the contracted half matters far more than its share. Moving the share by 2.5 points changes the value by about 1%.
I paid 1,200,000 won. That is the bottom of the contracted range and inside the range without contracts. If the contracts hold, the entry is cheap. If they prove soft, it is fair. I am not claiming a deep-value bargain: the discount exists only if the contracts hold.
The Chart: A Floor Tested Four Times in One Week
If the entry is cheap only when the contracts hold, why buy at the October 23 open? Because the price action held a level.
Since peaking intraday at 2,987,000 won on June 25, SK hynix has traced out an almost textbook three-leg correction (down, up, down) [1]:
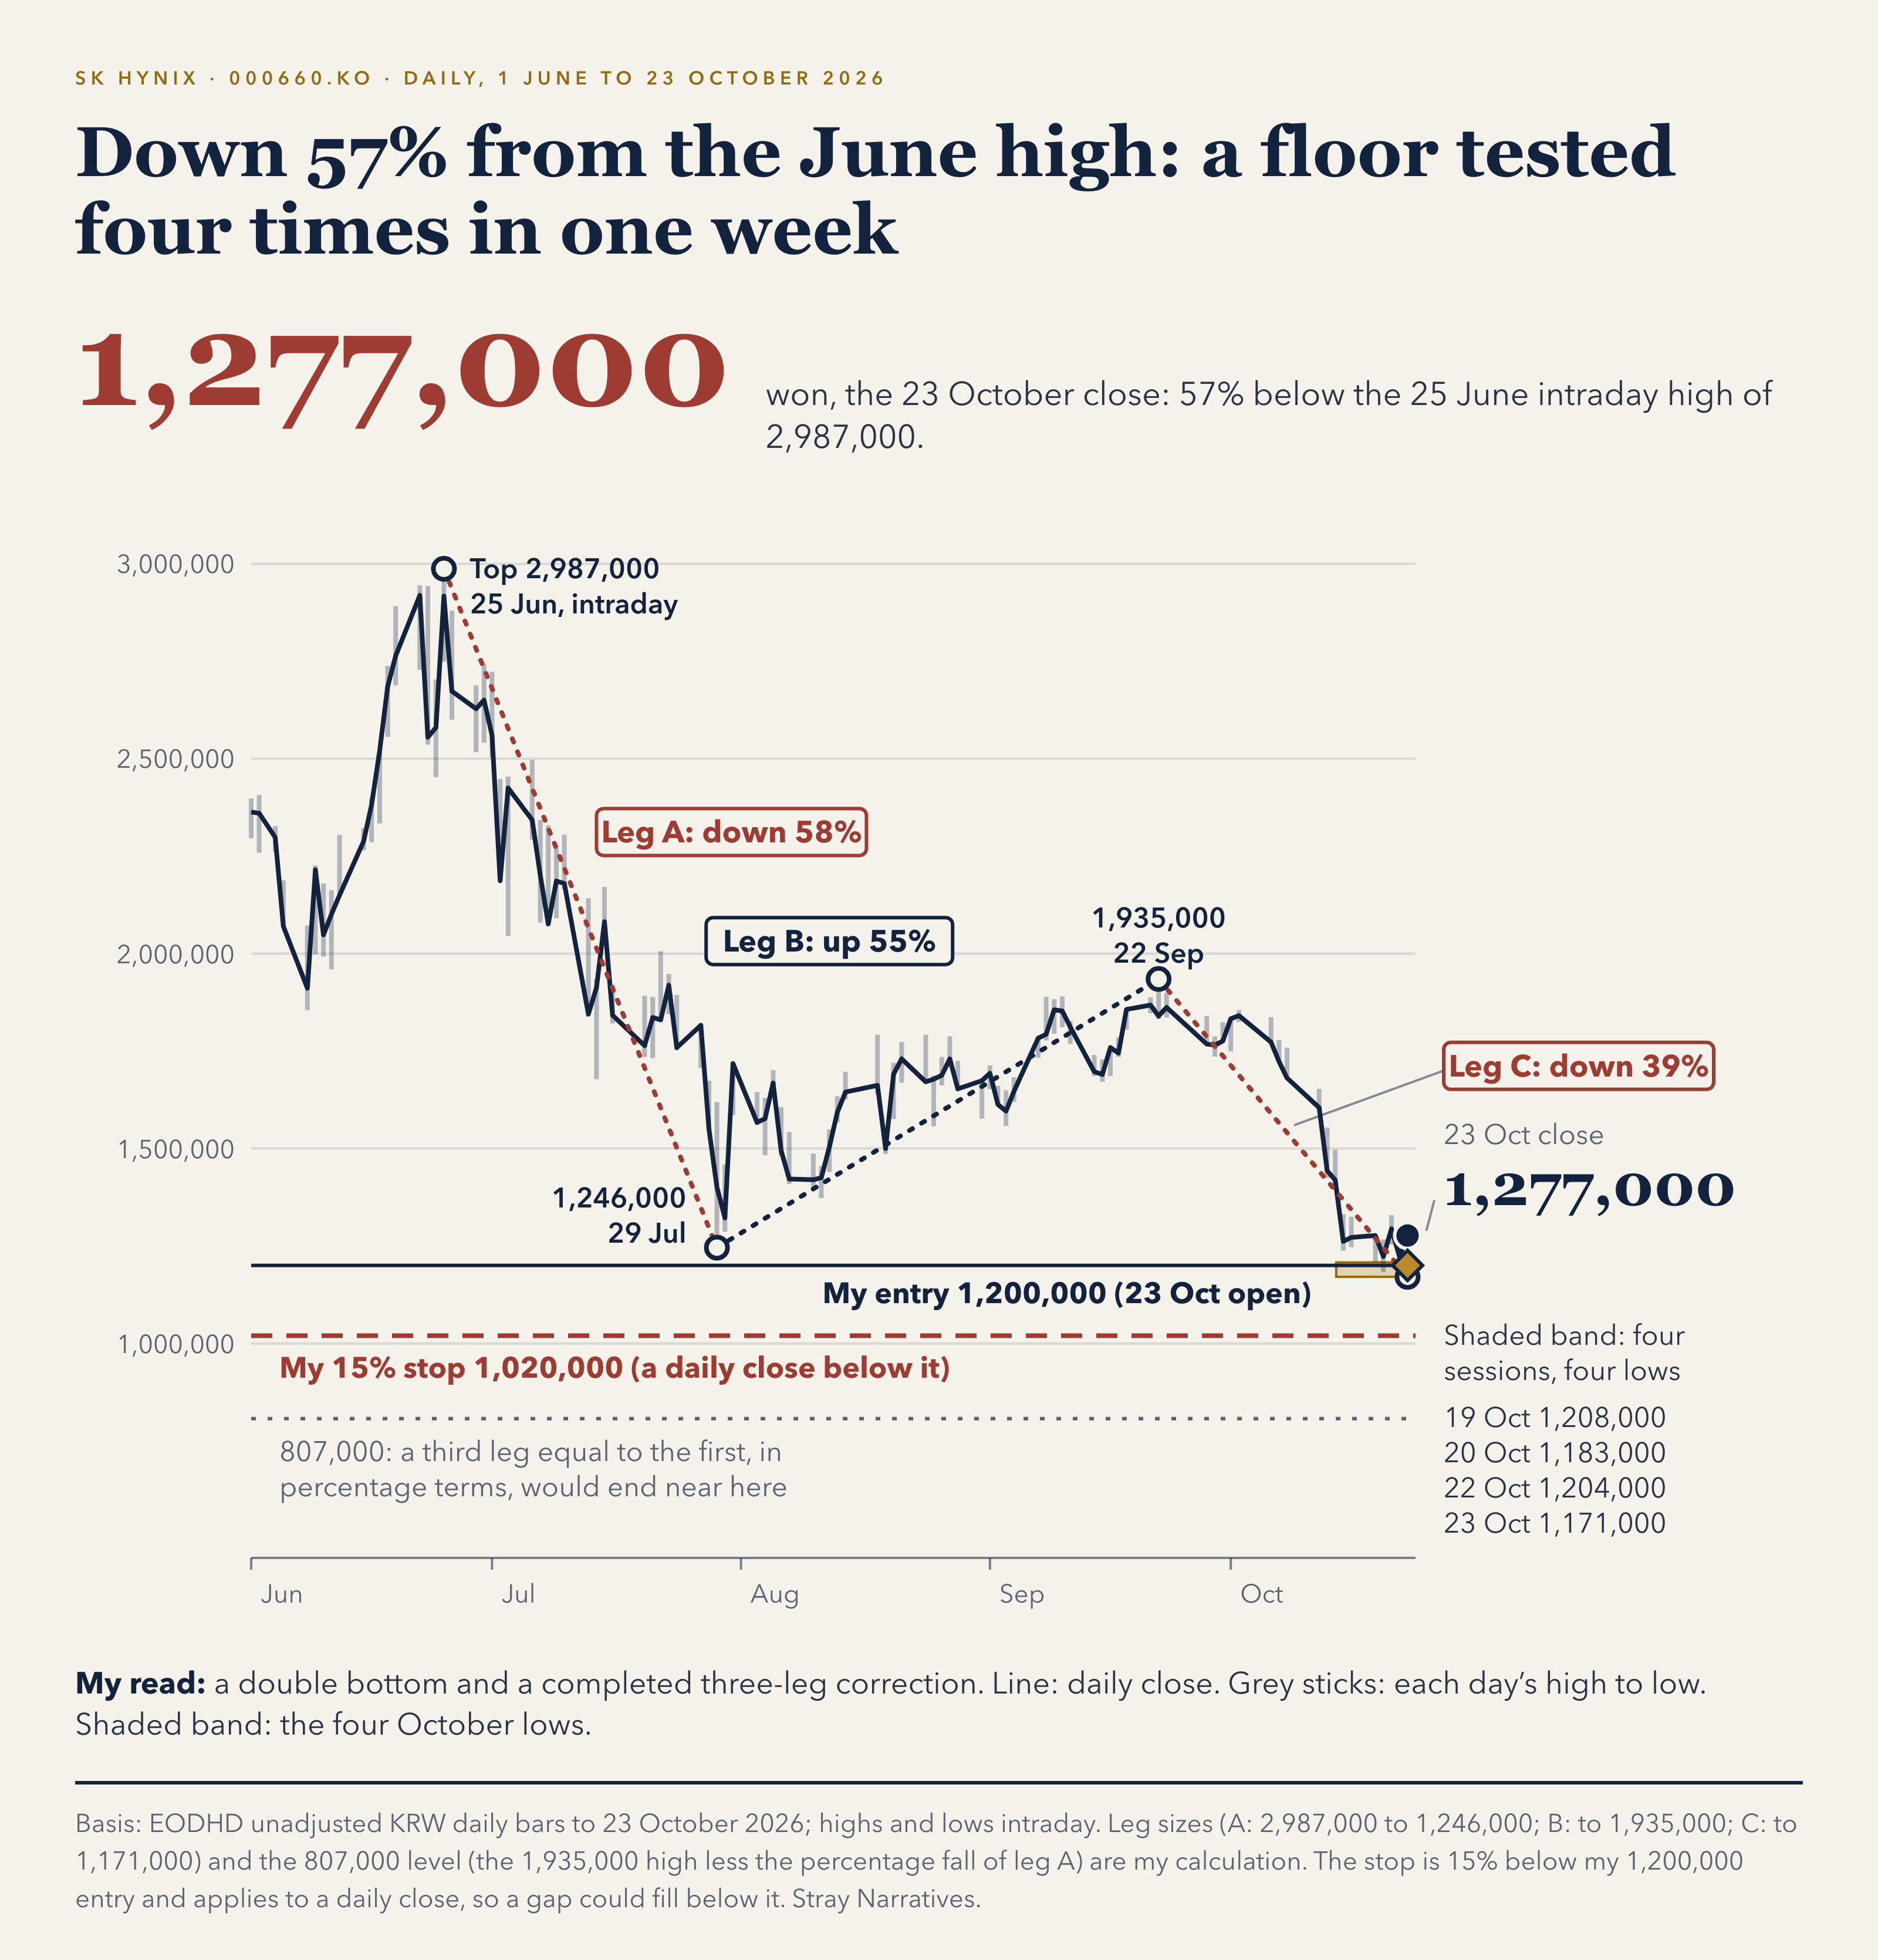
Leg 1 (Down 58%): Dropped from 2,987,000 to 1,246,000 on July 29.
Leg 2 (Up 55%): Rebounded to 1,935,000 on September 22.
Leg 3 (Down 39%): Pulled back to an intraday low of 1,171,000 on October 23.
Look at what happened during the third week of October: across four sessions (October 19, 20, 22, and 23), the stock fell to intraday lows of 1,208,000, 1,183,000, 1,204,000, and 1,171,000 won—undercutting the July 29 and October 15 lows, yet holding within a tight 3.2% band of each other [1]. I found no negative company disclosure behind the October drop; Korean press blamed foreign outflows, a strong US inflation print, and an unproven memory-chip claim from a Chinese competitor [16]. Two lows sitting 1% apart (1,183,000 and 1,171,000) form a classic double bottom, completing the three-leg correction from June.
I bought at the October 23 open (1,200,000 won), before that morning’s 1,171,000 low and the subsequent reversal, without waiting for textbook confirmation. Fair warning: the third leg is truncated. Measured in won, this final drop was only 44% the size of the first leg down (and 57% on a logarithmic percentage scale). If the third leg matched the first leg in percentage terms, the stock would bottom near 807,000 won.
Because that risk is real, I hold this trade with a hard stop-loss.
The Payoff Matrix: Two Ways to Win, One Way to Lose
Here are my three un-weighted price outcomes over the next seven months, which run to the mid-May 2027 lock-up releases. Returns are calculated from my 1,200,000 won entry, in won, price only, before tax and costs. Values use 728.87 million shares, the count before the buyback that Korean press reports finished on October 21; no DART filing confirms it yet [14][16].
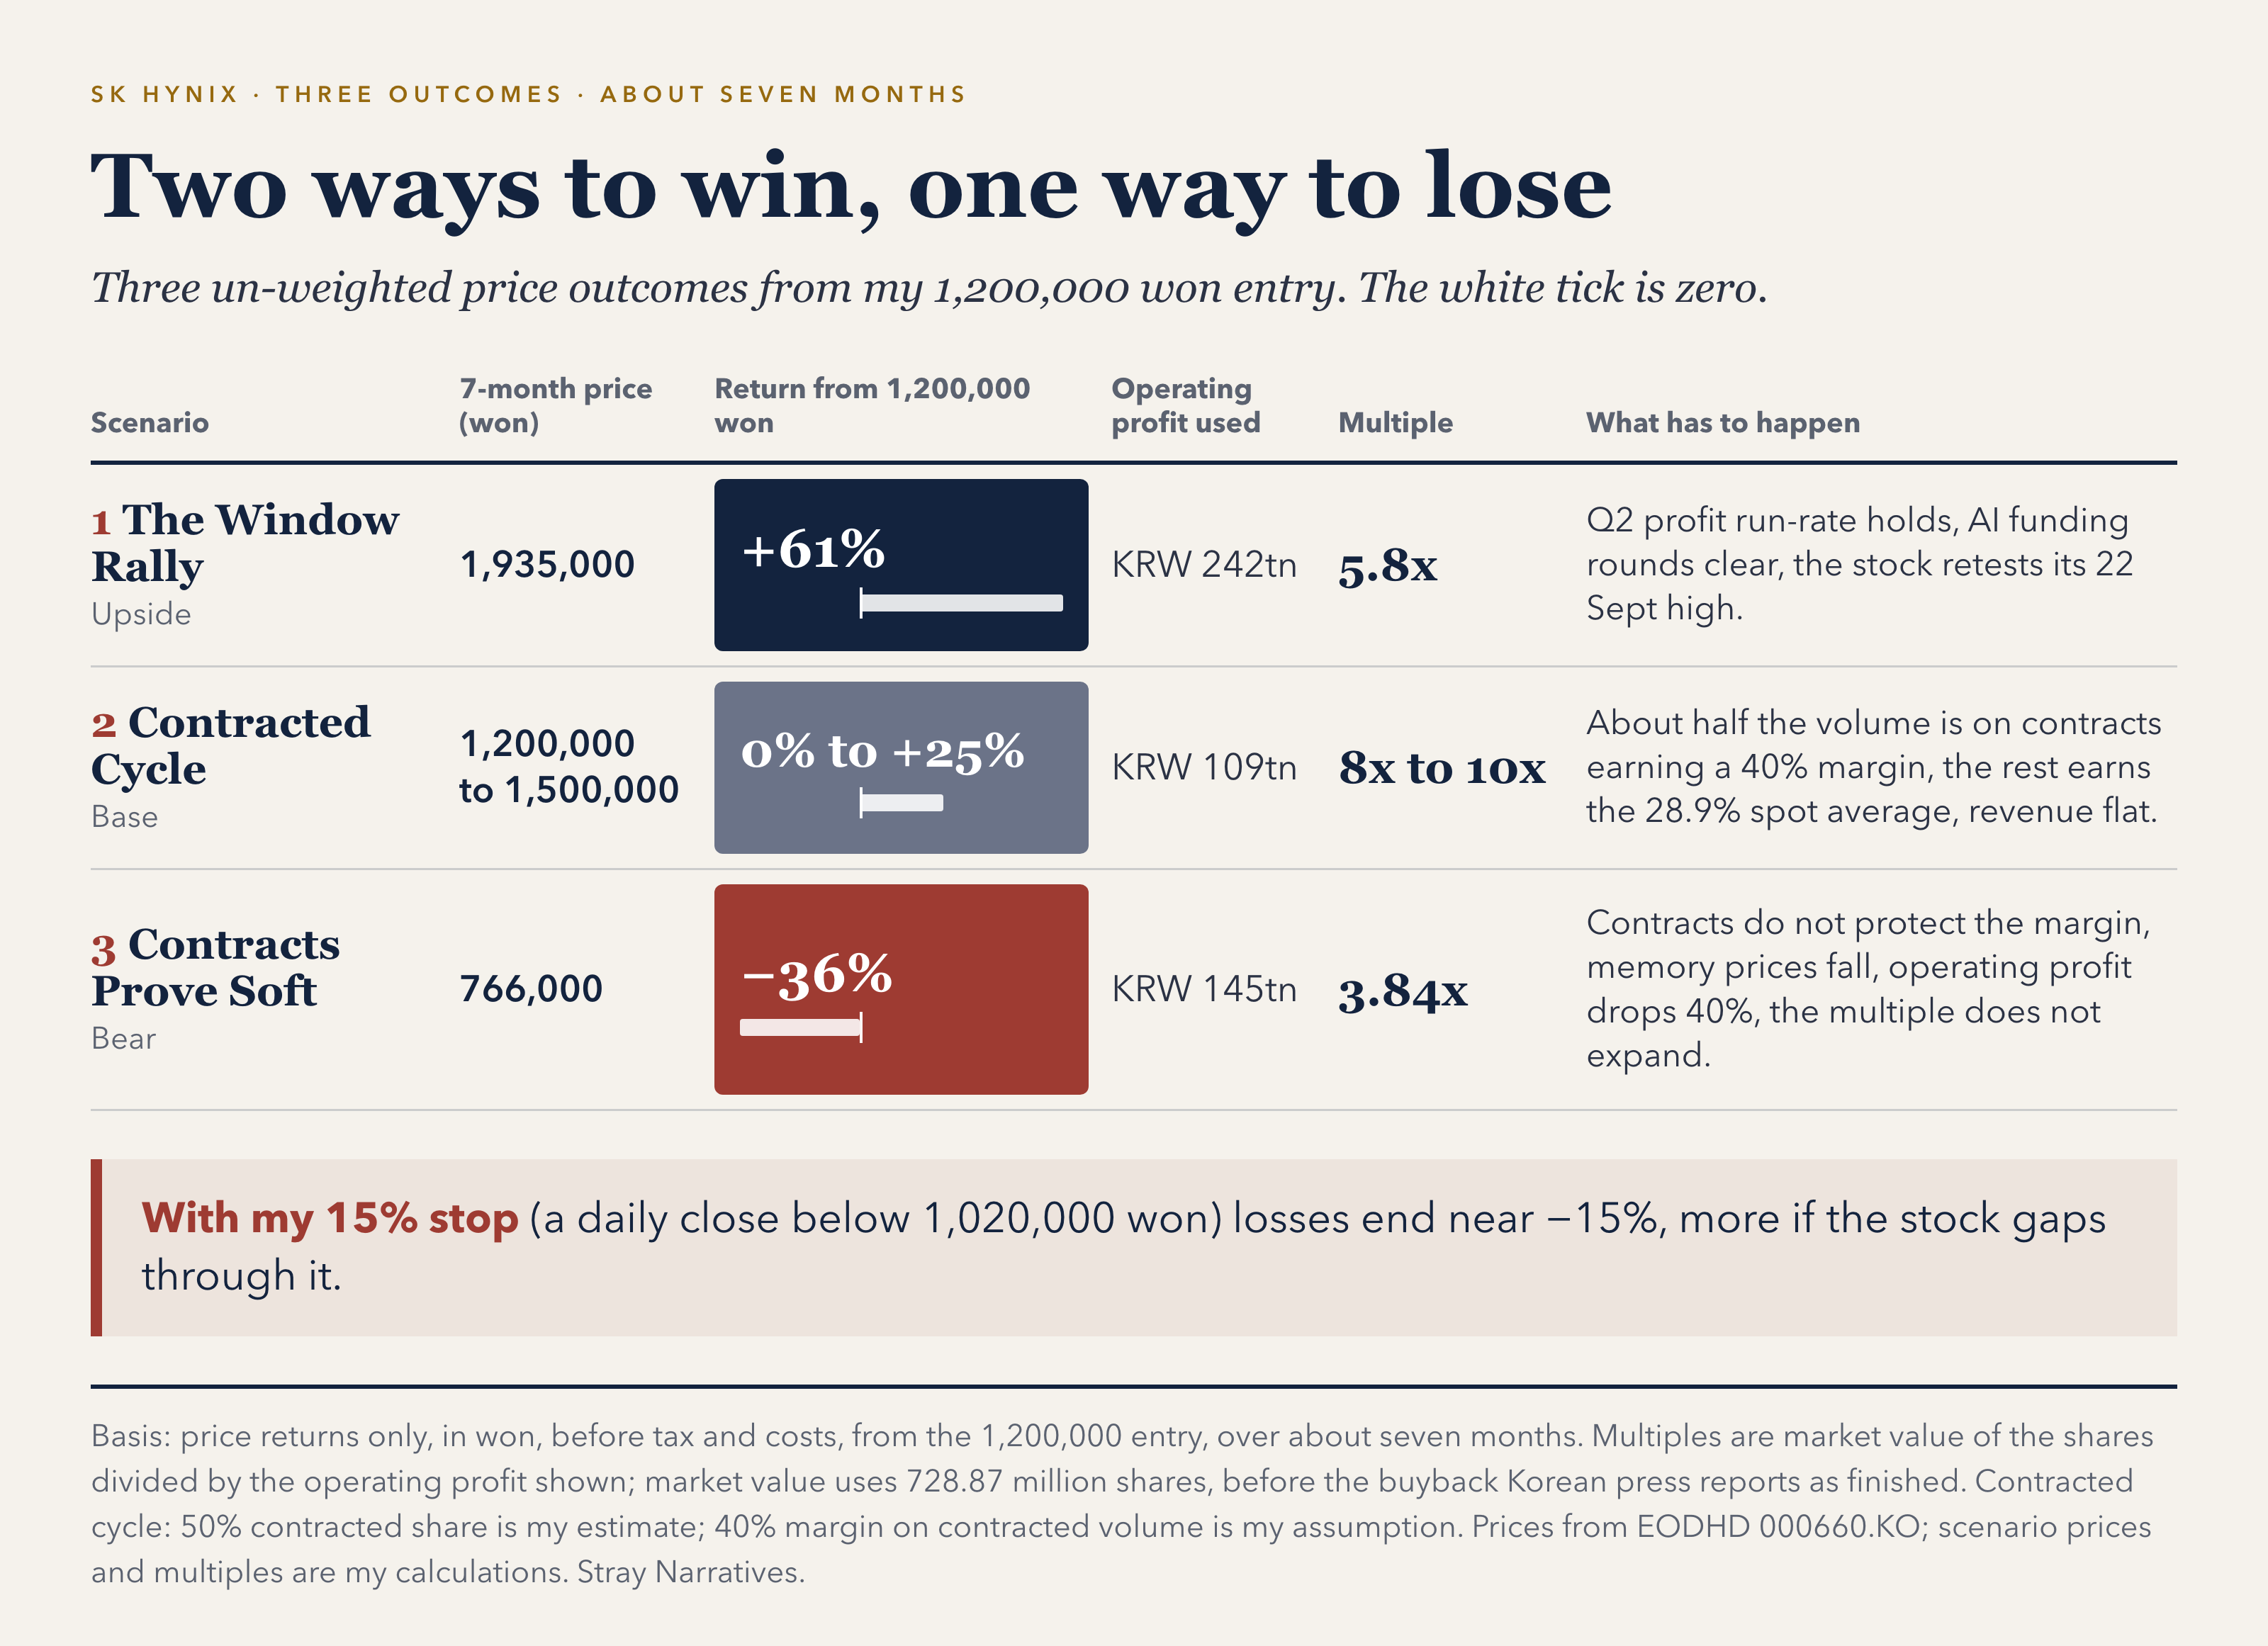
This is not a value investment unless the contracts hold. Two of the three outcomes make money or break even at the low end: the window rally at 1,935,000 won and the contracted cycle at 1,200,000 to 1,500,000 won. One loses 36%: contracts prove soft, at 766,000 won. The trade rests on two things. The seven-month capex window has to put the stock in one of the first two outcomes. And my 15% stop-loss at 1,020,000 won has to cut off the left tail of the third at roughly −15%, unless the stock gaps through it, instead of −36%.
Five Kill Switches: How I Know I’m Wrong
To keep discipline tight across a volatile seven-month trade, I am tracking five specific triggers—starting with SK hynix’s third-quarter earnings call on October 28 at 09:00 Korea time [17]:
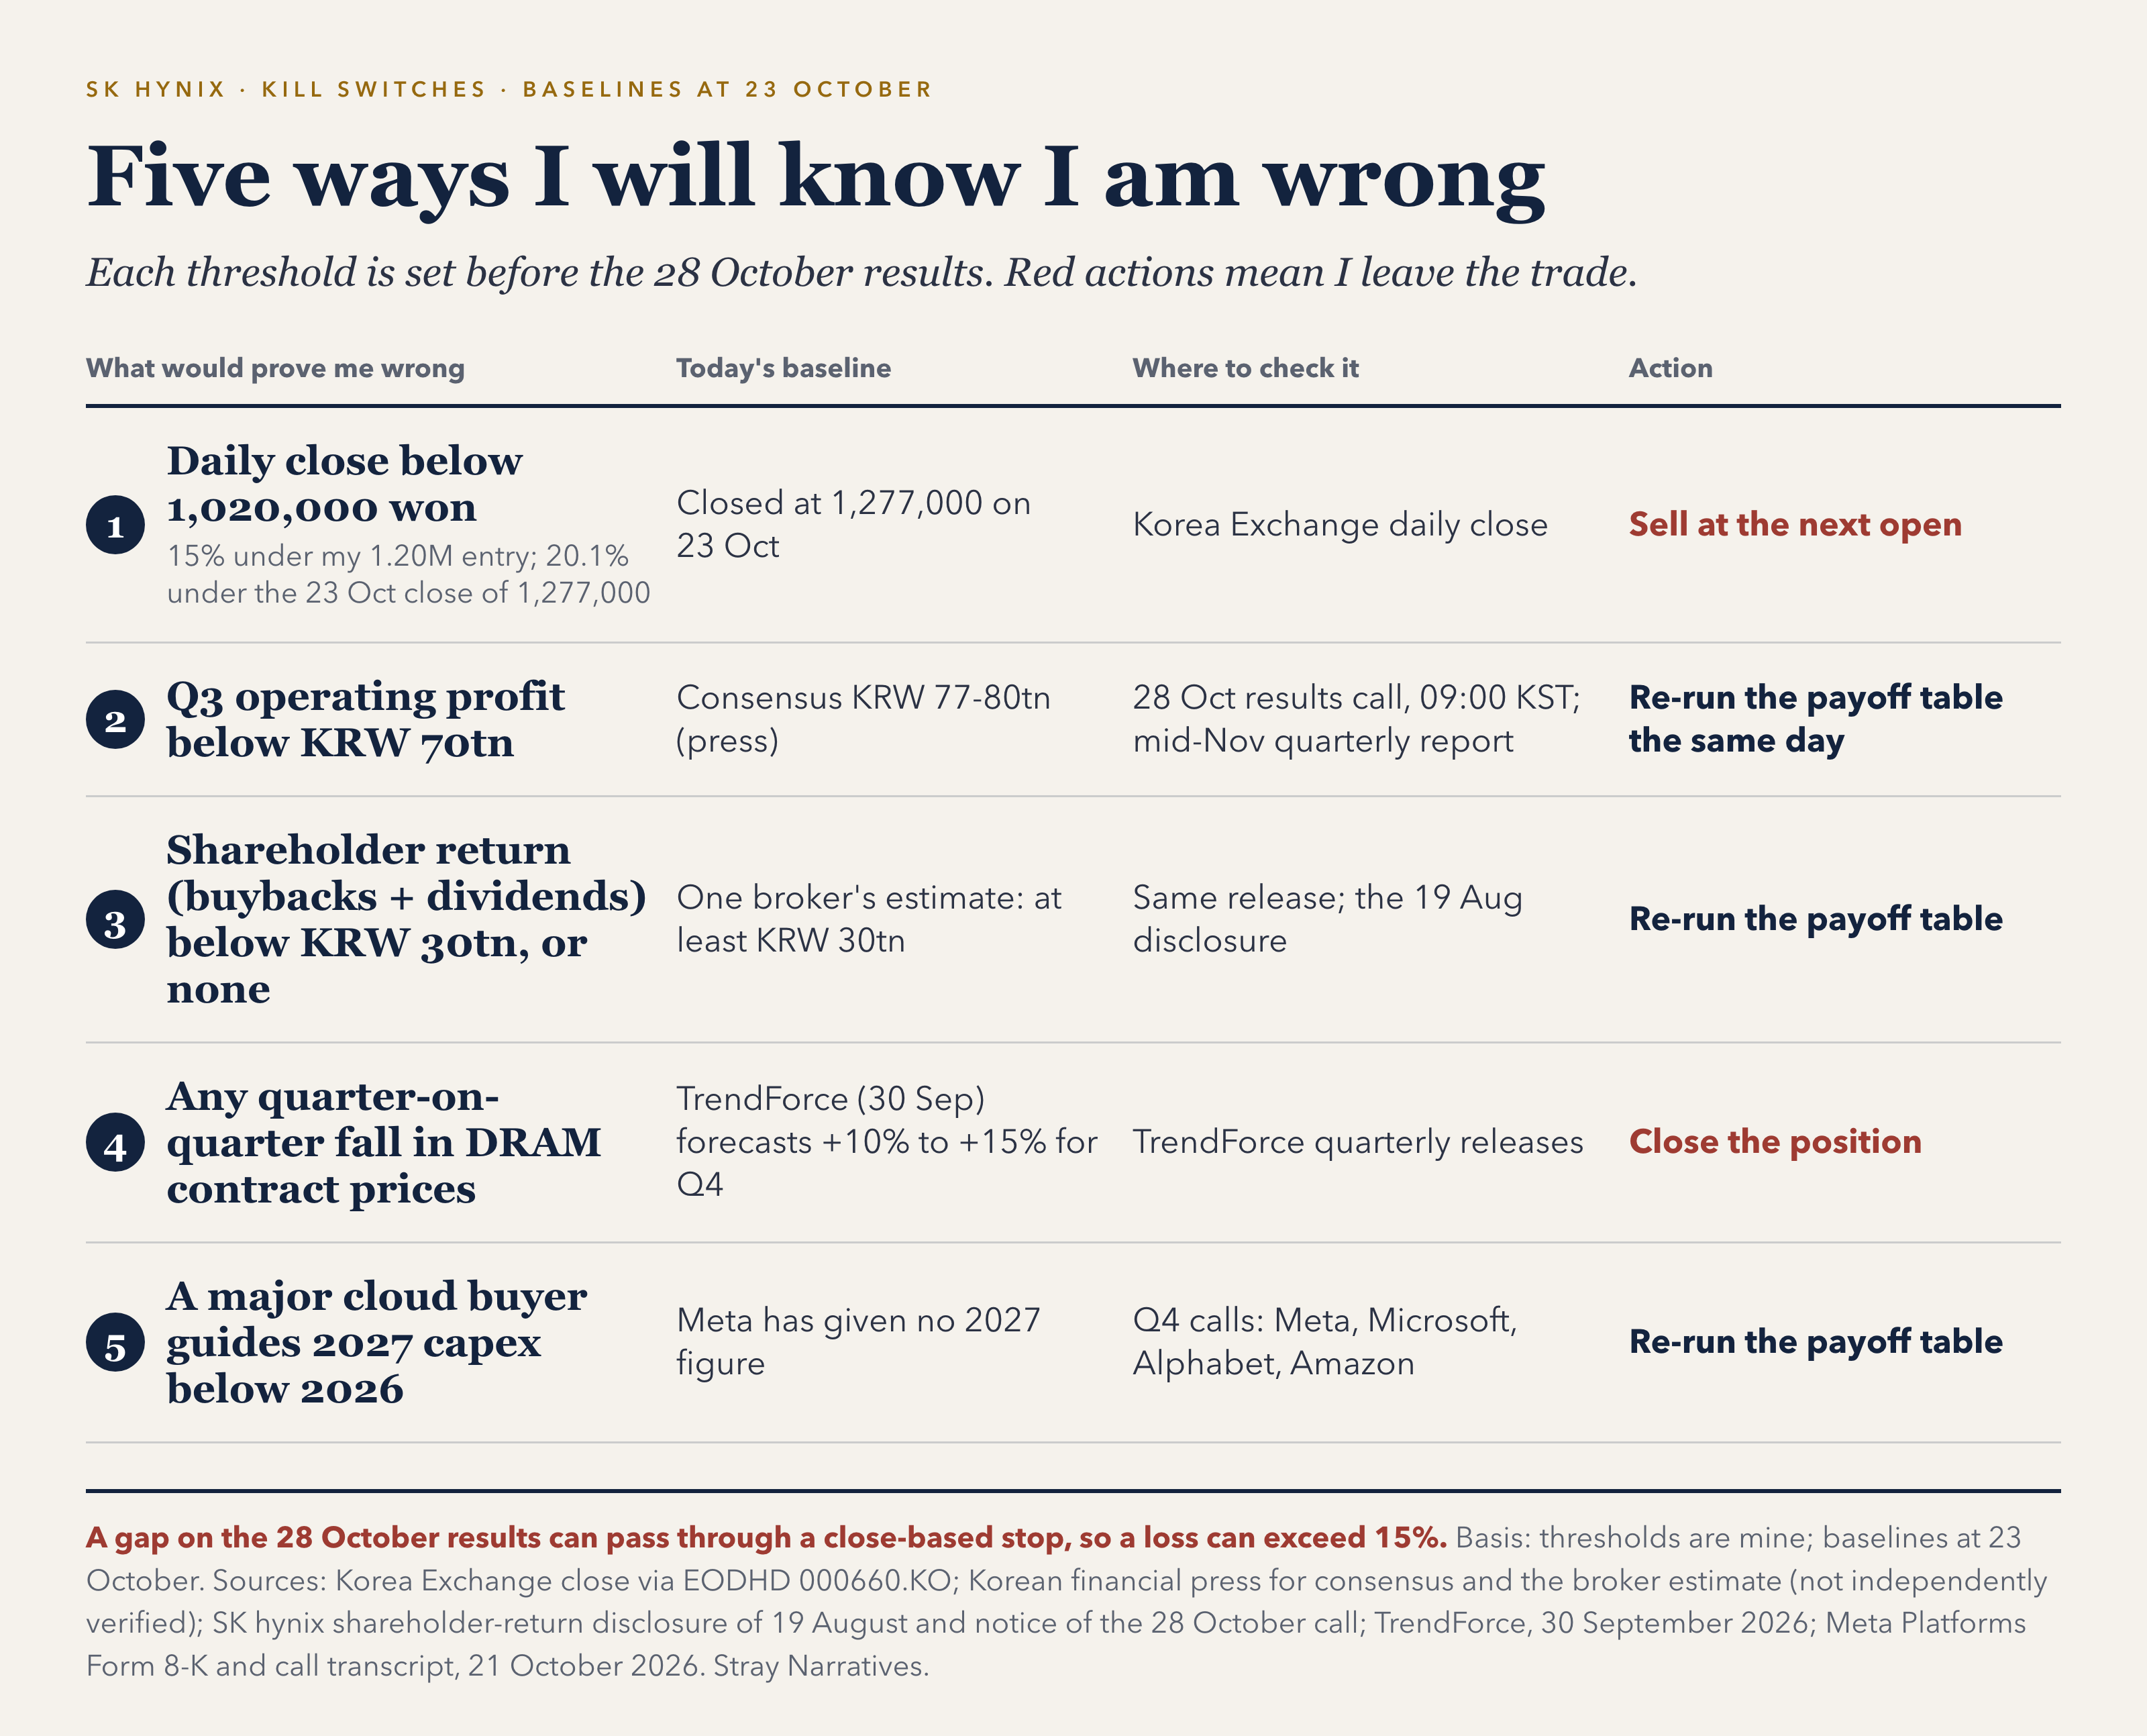
If SK hynix quantifies its contracted share or its price floors on October 28, or Samsung does on its own third-quarter call, I re-run the payoff table the same day. The third-quarter report in mid-November shows whether contract liabilities rose well above KRW 523.5 billion [14][17].
One practical risk note on the stop-loss: Over the past 20 trading sessions, SK hynix has moved an average of 3.5% a day [1]. Because my stop requires a daily close below 1,020,000 won—and because Q3 results arrive at 09:00 on October 28, as the market opens—a sharp drop on bad numbers could blow past 1,020,000 won, resulting in a realized loss larger than 15%. That is the cost of trading the window, and I will exit completely before the mid-May 2027 lock-ups arrive.
References
[1] EODHD, 000660.KO daily bars to 23 October 2026, META.US, MU.US, 005930.KO, GSPC.INDX, and SOX.INDX daily closes for 2008 and 2026, and USD/KRW. Leg sizes, multiples, market value, scenario prices and the declines since 30 June (SK hynix −52%, Samsung −35.5%, Micron −24%, 23 October closes against 30 June closes) are my own calculations.
[2] Stray Narratives, Issue 33 (6 October 2026) and Issue 34 (16 October 2026): the four sources of AI funding and the sequence of the bust.
[3] Meta Platforms Form 8-K (Items 1.01 and 2.02, with Exhibit 99.1) and third-quarter 2026 earnings call transcript, 21 October 2026. The fourth-quarter capex range is my own calculation from full-year guidance and nine-month spending.
[4] TSMC third-quarter 2026 earnings call, 15 October 2026 (the call began at 06:00 GMT, 15:00 in Seoul). The July comparison is from press reports of the July call.
[5] Micron fiscal fourth-quarter 2026 results and prepared remarks, 30 September 2026: supply outlook, 26 strategic customer agreements covering more than 35% of revenue through 2030, a defined pricing framework on three-quarters of that revenue (a majority with floors and ceilings), and $32 billion of customer commitments; Micron Form 10-K (take-or-pay terms, minimum and maximum bands) and Form 10-Q, SEC accession 0000723125-26-000015 (ceilings on the largest agreements near the second-quarter 2026 market price).
[6] Meta Platforms Preliminary Schedule 14C information statement, filed 21 October 2026, SEC accession 0001628280-26-066710.
[7] Federal Reserve Board press releases on the JPMorgan Chase and Bear Stearns arrangement, 14 and 16 March 2008; JPMorgan Chase Form 8-K, 16 March 2008; SEC Chairman’s letter of 20 March 2008 (press release 2008-48) on the funding run; Lehman Brothers Chapter 11 filing, 15 September 2008.
[8] FRED, federal funds target range upper and lower limits (DFEDTARU, DFEDTARL): 25-basis-point increase to 3.75%–4.00% (FOMC statement of 16 September 2026; FRED reflects the new range from 17 September).
[9] Willow Lake Strategic Advisors, “The Case for an Explosive AI Stock Rally into Mid-2027”, 19 October 2026, public Substack (https://willowlakeresearch.substack.com/p/the-case-for-an-explosive-ai-stock). Dates are the author’s estimates; the author discloses long positions in most named stocks and assumes a 25% lock-up sell-through.
[10] Stray Narratives, Issue 30, “The Largest Buyer Just Left”, 3 September 2026 (inputs: initial offerings $146B YTD, follow-ons $92B in 1H, builders’ float growth ~$140B/yr), and my de-duplication of Alphabet’s June raise (Alphabet Forms 8-K and pricing prospectuses, June 2026). Updated pace: US IPOs $148.0B YTD (Renaissance Capital); the five builders’ net issuance (gross share sales and stock compensation net of buybacks) from company filings through 22 October (Meta and Oracle; run-rate estimates for Alphabet, Microsoft and Amazon, whose third-quarter reports were not yet filed).
[11] My own estimate of 2027 US equity supply and lock-up sales, 23 October 2026. The size and timing of Meta’s raise, the OpenAI listing, Anthropic’s size, date, and lock-up, and insider sell-through rates reflect press reports or my assumptions. Meta’s filing states it expects to need equity without specifying size or date. The $20B Alphabet comparison includes $16.75B of mandatory convertibles.
[12] Anthropic public filings: none found on SEC EDGAR as of 23 October 2026. Press reports of a planned filing are not used.
[13] SK hynix 2Q26 results release (29 July 2026, Seoul time) for the customer count; Q2 2026 results presentation (slide 10) and the 29 July earnings call for the term, volume commitments, deposits and pricing mechanisms (transcript text from Investing.com, not checked against the company’s audio); quarterly figures for 2025 and 2026; annual reports for 2018 to 2025 (operating profit of 20.84, 2.71, −7.73, and 47.21 trillion won for 2018, 2019, 2023, and 2025). The 28.9% operating margin is revenue-weighted across 2018 to 2025, my own calculation.
[14] SK hynix half-year report to 30 June 2026, DART receipt 20260814003509: order status (the report covers the period to 30 June, before the July agreements) and balance sheet (cash, the Kioxia-linked holding and contract liabilities of KRW 523.5 billion). Share count of 728,866,596 is 730,492,365 issued shares (cancellation decision, KIND 20260819000340) less 1,625,769 treasury shares (DART 20260819000254) at 19 August 2026, prior to the start of the buyback. The half-year report lists 711,075,500 shares outstanding at 30 June, before 17,790,000 ADR shares were issued in July.
[15] Samsung Electronics second-quarter 2026 earnings call, 30 July 2026 (third-party transcripts, not checked against the company’s audio): 60% to 70% of planned capacity under long-term agreements, minimum price floors on mainstream products, advance payments. Not in any Samsung filing: the half-year report (DART 20260814003699) says only that its overseas subsidiaries have multi-year memory supply contracts with multiple global customers, terms withheld, and shows group contract liabilities of KRW 23.6 trillion (KRW 14.0 trillion a year earlier), not split by business. The 50% share for SK hynix is my own estimate: the average of Micron’s 35% and the midpoint of Samsung’s range.
[16] Korean financial press, 14 July and 13 to 22 October 2026: drivers of the October pullback, reported completion of the buyback, third-quarter consensus (FnGuide, 18 October), shareholder-return estimate, Samsung’s preliminary results, and a named broker’s July estimate (Newdaily, 14 July 2026) that about half of SK hynix’s revenue was on long-term agreements. Not independently verified; DART carries no buyback completion filing as of 23 October.
[17] SK hynix shareholder-return fair disclosure of 19 August (KIND 20260819000338); notice of the third-quarter earnings call, KIND 20261014000385, and Form 6-K accession 0001193125-26-420934: conference call scheduled for 28 October at 09:00 Korea time; the notice says the call materials go online that day. The quarterly report is due within 45 days of quarter-end.
[18] TrendForce press release, 30 September 2026, fourth-quarter 2026 DRAM contract prices.