

As always, if you enjoy this article, please Like & Share, it means the world to me, really!
Click here for : Part1 - Part 2 - Part 3 - Part 4 - Part 5 - this is Part 6

At its most generous estimate, the entire AI industry is running at $250 billion a year in revenue. [1] Yet, according to press reports of its forecast, Moody’s expects just the six builders it tracks to spend $785 billion on facilities and equipment this year, and about $1 trillion the next. [2]
Revenue covers probably only 25% of the spending. The estimate dates from August, and on the independent tally Part 1 used, revenue has grown at least 35% a quarter for four quarters [3] but the spending is growing too. For now the builders’ own businesses pay the difference: search, advertising, software, shopping and, increasingly, renting out computing. I expect this to end not as a spectacular overnight crash, but as a bust that builds in sequential stages as the funding pockets run dry.
The Four Pockets of Capital
Four sources of money matter most and each has a limit approaching fast.
Spare cash is nearly gone. The businesses still pay for almost everything: the cash their operations generate covered 104% of Microsoft’s, Amazon’s, Alphabet’s and Meta’s capital spending in the June quarter, down from about 150% in 2025. At the end of 2025 they had about $60 billion a quarter left over after capital expenditures. By the June quarter of 2026, that cushion had vaporized to under $7 billion. [4] Analysts already expect the free cash flow of those four plus Oracle, after stock pay, to fall to about minus $265 billion on a trailing basis by the third quarter of 2027, and to recover to about $505 billion by 2030. [5] The problem? I do not think that trough gets funded on today’s terms.
Debt has a ceiling. Since January 2025, the three builders that borrow in the bond market have raised about $280 billion. [6] Add Microsoft, and the four have also signed $836 billion of leases that have not started yet. Those payments are not yet on the balance sheet. [6] Held to the debt levels typical for companies rated BBB or BB, the four companies’ room to borrow more is anywhere from nothing to about a trillion dollars, depending on which test is used and whether the leases count. These are comfort levels, not limits. [7] On a range of assumptions about how much of their spending they borrow, that room runs out between 2027 and 2030, and in early 2028 in my middle case.
Equity can fill only a little. Alphabet, the largest of them, has already begun selling shares, about $45 billion placed in June, partly to fund the build. [8] The two big labs’ listings would add more. They are the first test below, and they could go either way.
Vendor credit is the weakest link. The companies selling the chips and the compute are now lending to, or standing behind, the customers buying them. Nvidia has agreed to cover up to $105 billion of a customer’s lease payments if that customer defaults. The guarantee starts with the first leases, expected from 2028, and OpenAI has agreed to reimburse Nvidia for anything it pays, which is thin comfort if OpenAI is the party that cannot pay. [9] Amazon has invested $50 billion into a lab that turns around and buys Amazon’s computing. [10]
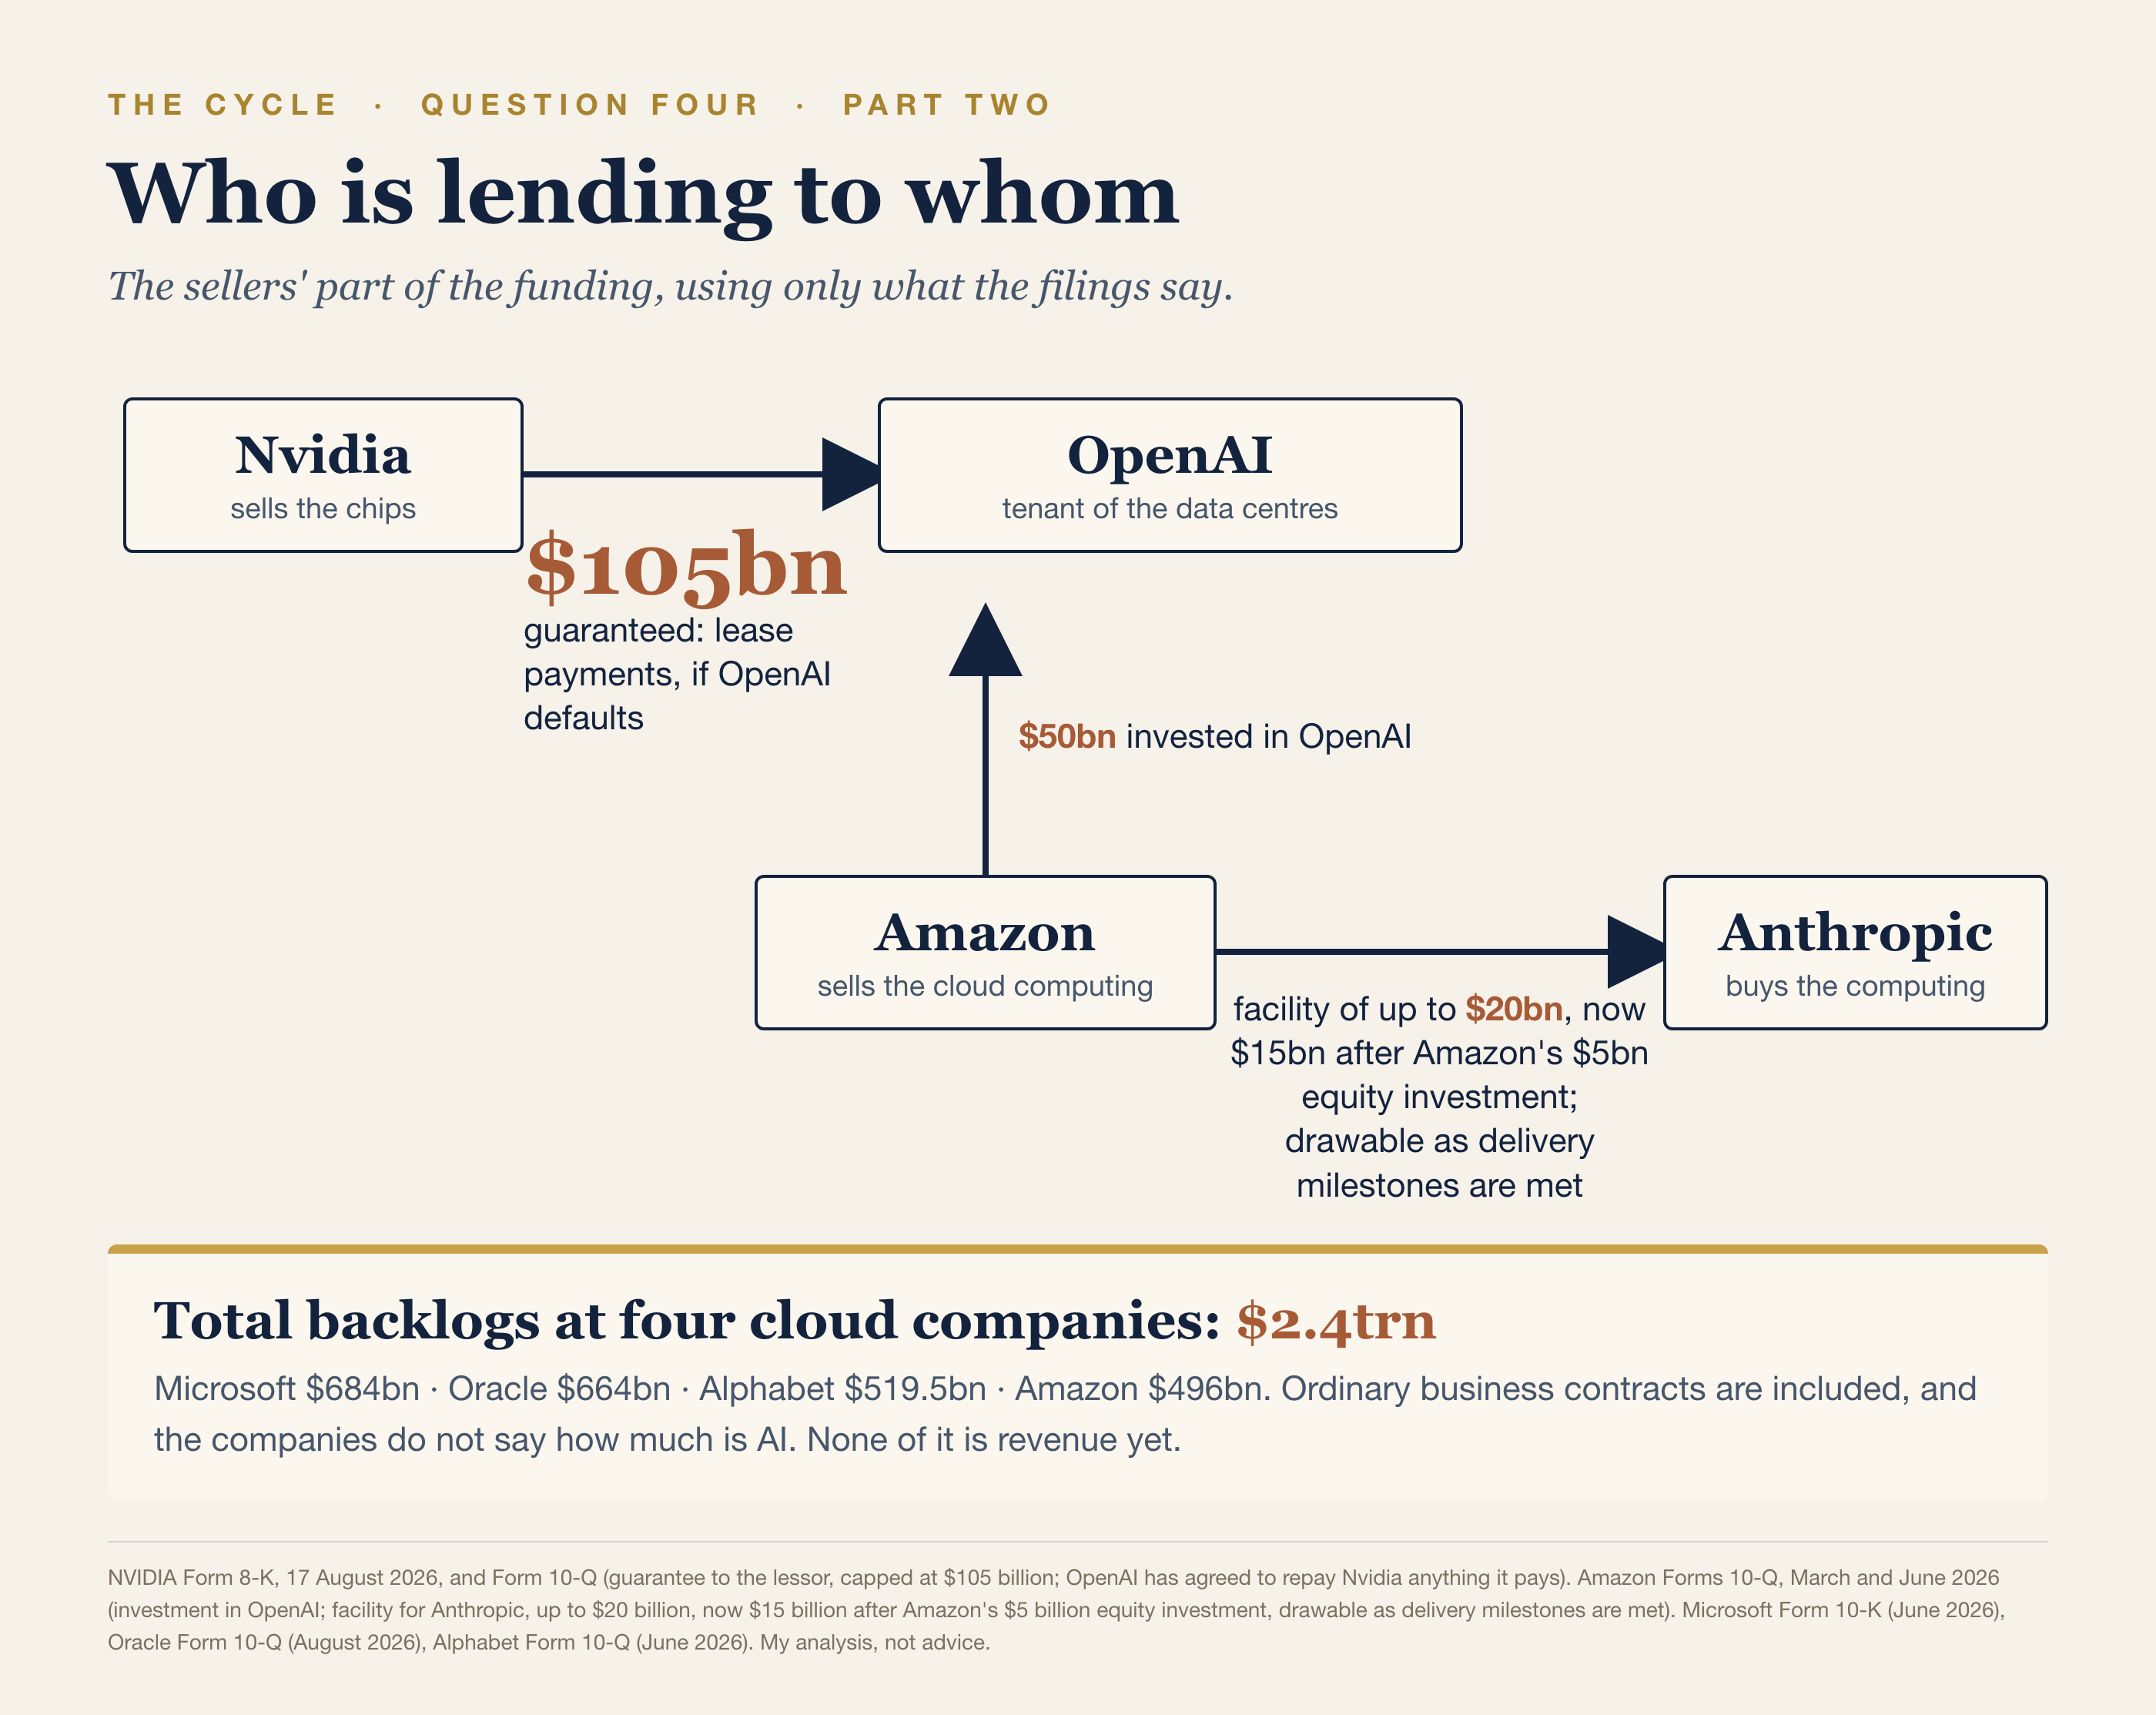
The money is moving in a circle. It works beautifully—provided the weakest members of that circle, the independent AI labs, can continually raise outside capital. They have the thinnest cushion. OpenAI agreed a $122 billion round in March at an $852 billion value, and Anthropic raised $65 billion in May at $965 billion. [11] Neither publishes accounts, so I cannot say how many months that lasts.
There are other sources: private credit, joint-venture debt and customer prepayments. Each delays the date and a government could also decide the labs are strategic and fund them, although unlikely under a democratic majority.
There is no fraud here and every piece is disclosed, legal, and individually rational. Nvidia booked $164 billion of data-center revenue in its last two quarters and $117 billion of operating profit across the company. [9] That is real cash. The best reply to me is that this profit shows the product earns its price. It shows buyers paid it. Whether they earn it back is the question of Part 1. Vendor financing is a discount that never shows in the list price or the reported margin until it is paid. A structure that pushes all the true costs into the future still hides them. In the year to July 2000, Cisco earned record profits selling the routers that built the internet. The next year it lost $1.0 billion and took a $2.25 billion charge for excess inventory. [12] Profit that exists because the spending continues is not proof that the spending will be profitable.
Buying Insurance on Monopolies
The bull case requires AI to become a utility everyone pays for, akin to a smartphone or streaming service. It models hundreds of millions of subscribers paying $100 a month by 2030, with infrastructure owners keeping 75 cents of every dollar, and capital spending slowing down to let returns catch up.
That narrative fails on contact with reality.
First, the price has to beat free. Google, Meta, and Apple give their core assistants away and charge only for heavier use or add-ons. Even if 600 million people paid $30 a month, that yields $216 billion a year. That is more than Netflix, Spotify, Disney’s streaming, Amazon’s subscriptions, Microsoft’s home Office, and ChatGPT collect from consumers worldwide combined, about $162 billion. [13] A $100-a-month model defies consumer gravity. That is the consumer version of the story. The business version is the one Part 1 tested: replacing payroll is the only wallet of those I could size that is large enough, and it moves slowest.
Second, the margin profile is wrong. Large listed software companies spend 20 to 33 cents of each revenue dollar on delivering the service. [3] If landlords keep 75 cents, the math breaks. And finally, nobody is going to voluntarily slow down their spending first.
They aren’t spending because the math works, they are spending because they fear their oligopoly could break.
For a decade, big tech earned astronomical returns because their moats—search, social networks, enterprise software—were practically unbreachable. An AI assistant that writes the document or answers the query without requiring the user to view an ad threatens those moats. The executives say it openly. In July 2024 Alphabet’s chief executive told investors that the risk of under-investing was dramatically greater than the risk of over-investing. Meta’s chief executive said in September 2025 that misspending a couple of hundred billion dollars would be very unfortunate, but that the risk was higher on the other side. [14]
Alphabet’s and Meta’s cushion is search, advertising and social media. Those businesses depend on people arriving at their pages. If an AI assistant answers the question, the click does not happen. In a Pew Research study of 900 American adults in March 2025, only 8% of visits to a Google results page with an AI summary included a click on a traditional result. Without the summary, 15% did. [15] That must be pretty scary for Google. The study covers Google only, and the revenue shows no damage yet. Alphabet’s search and other revenue grew about 17% in the June quarter, and Meta’s advertising revenue grew 27.5%. [16] So it’s clearly not an immediate threat but more of a preemptive move when faced with a technology they can’t suppress.
This isn’t an investment evaluated on its cost of capital. It is an insurance premium. They are paying to ensure they own the new “front door” to the internet. So the return sums in Part 1 do not stop them. Two things can: the fear lifts, or the money runs short. I expect the money to run short first.
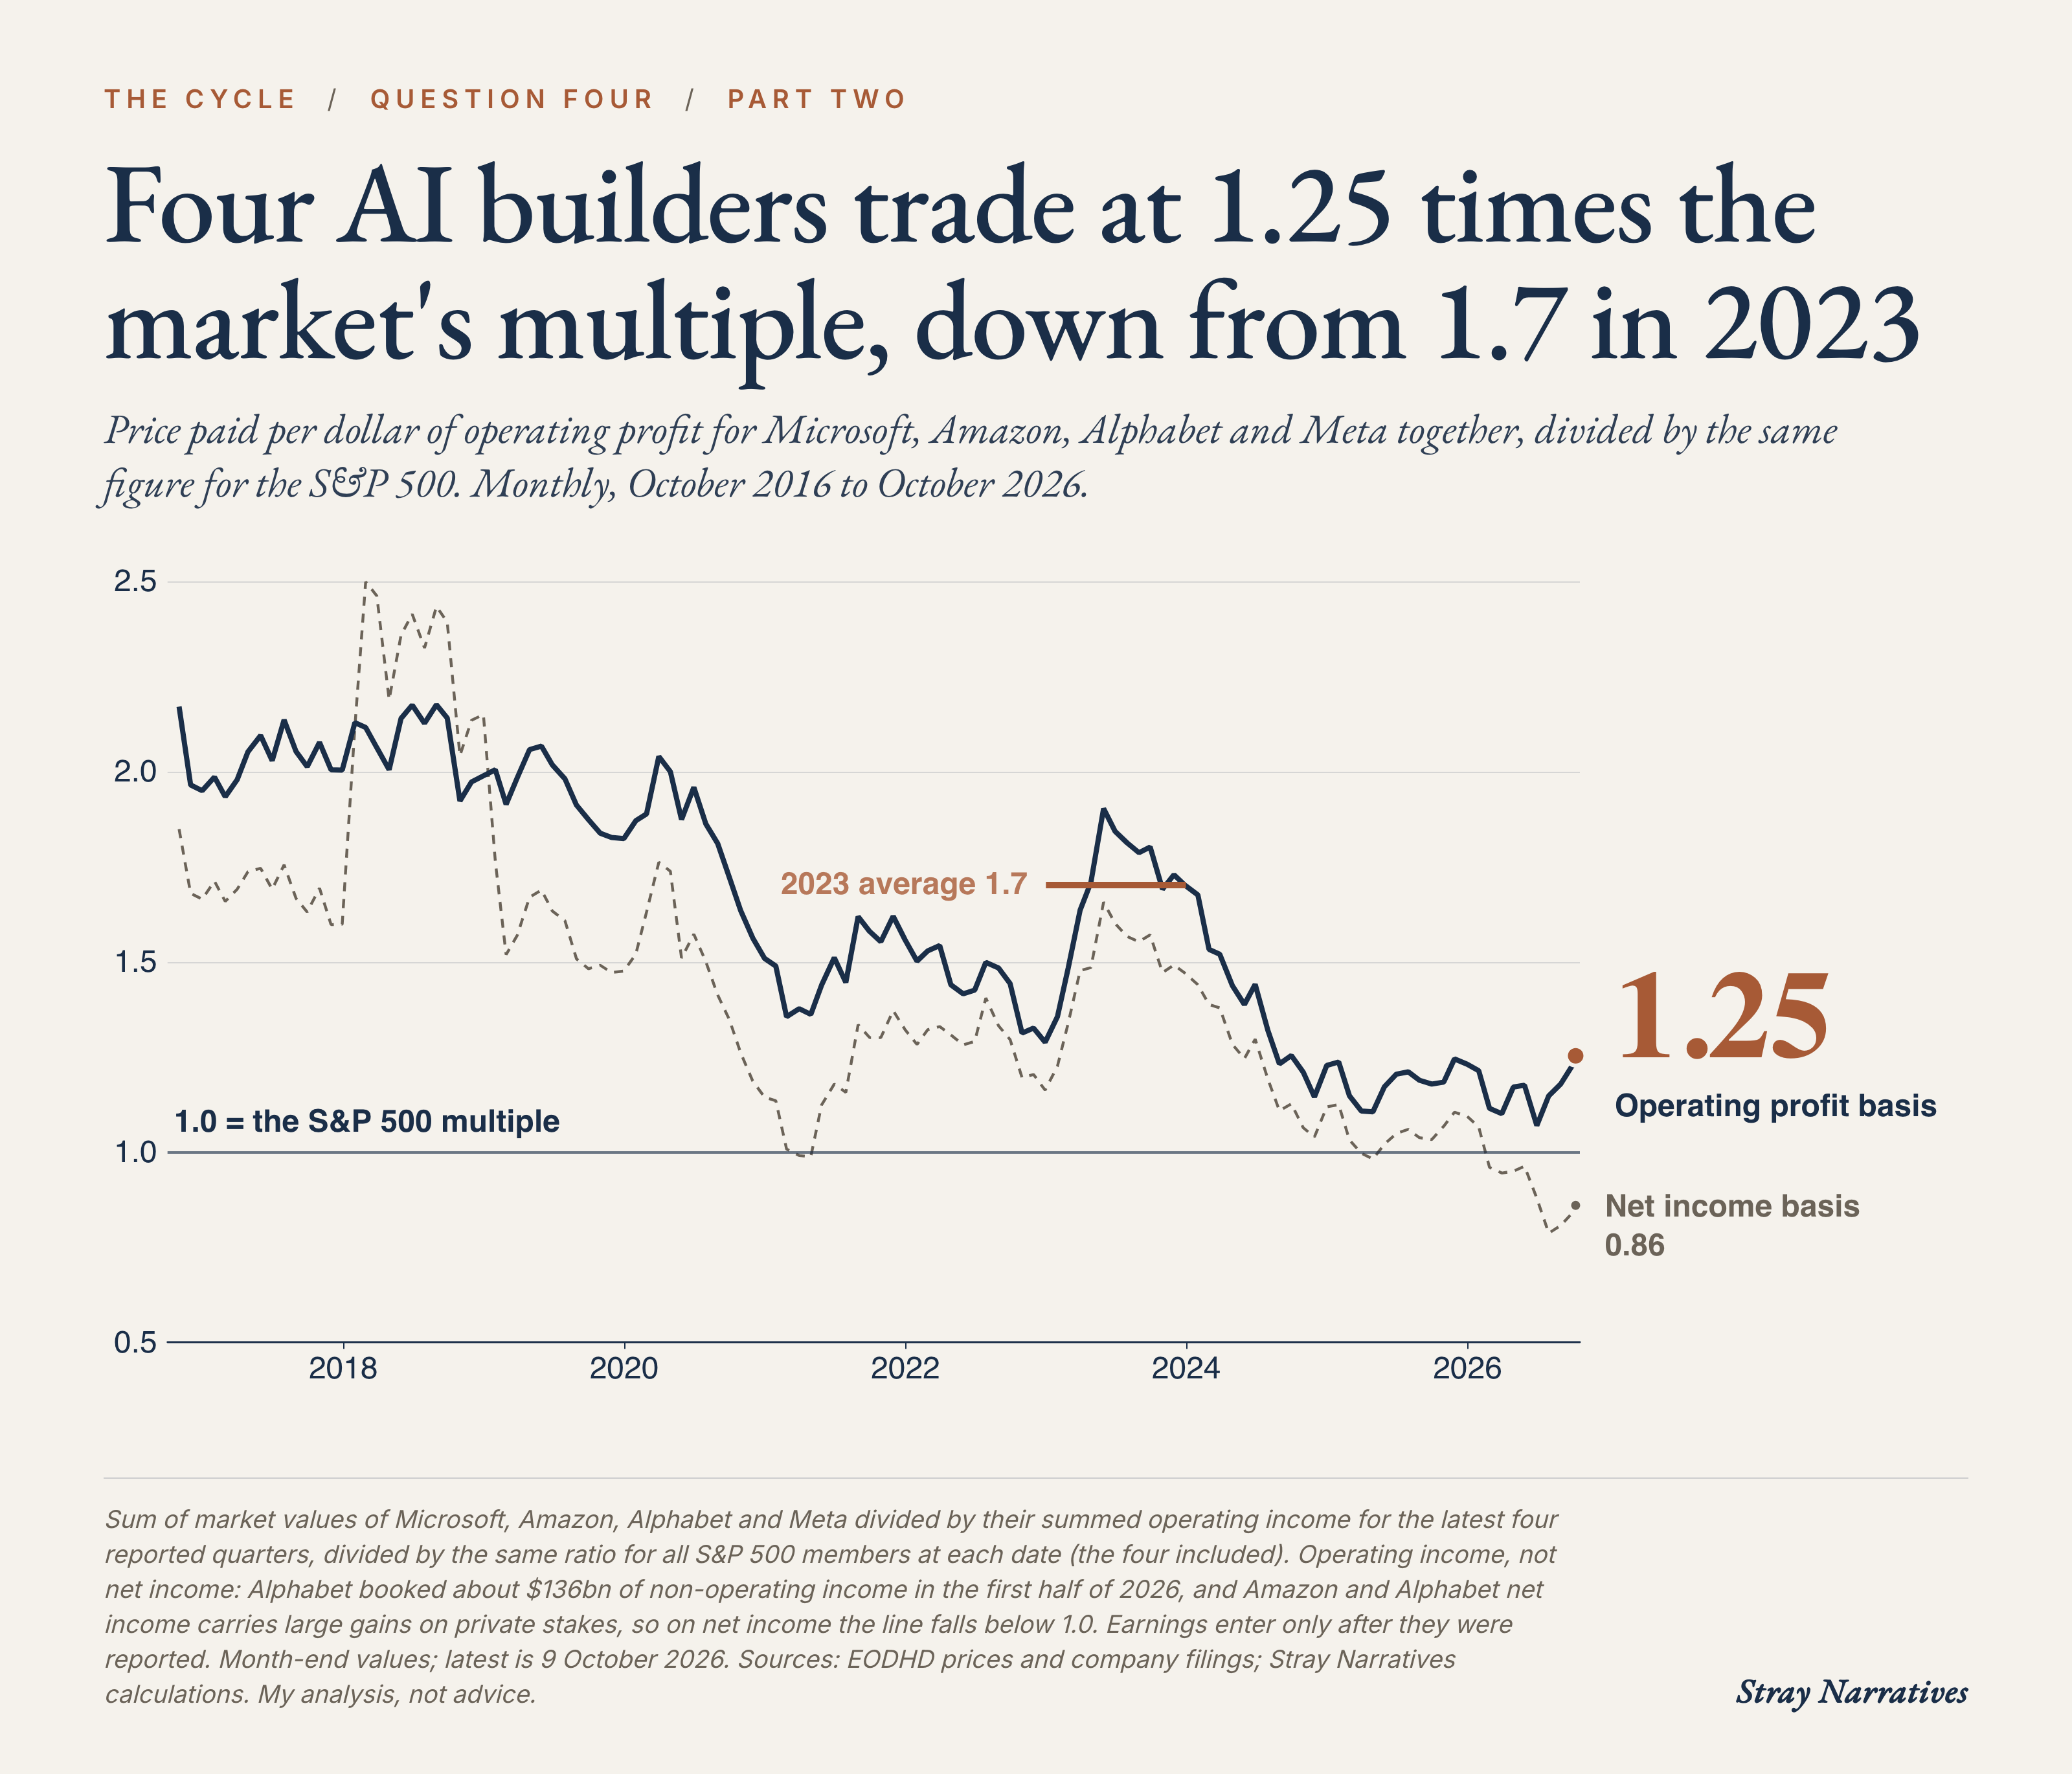
But as the mainframe era showed us, a cash machine doesn’t have to break to lose its value. In the early 1990s, corporate buyers delayed mainframe upgrades while waiting for client-server networks to mature. About a quarter of the mainframe demand that had been expected never arrived, before the new technology could do the work. [17] Search works the same way, just one layer removed: it is free to the user, but paid for by advertisers buying clicks. If an AI assistant answers the question directly, the click never happens. The moment advertisers and investors expect that traffic to shift, revenue growth stalls and the valuation multiple compresses—long before the core business actually breaks. The market already pays less for these four than it did. Remember, stocks peak before Capex.
The premium the market pays for these four, over the rest of the index, has been shrinking for most of ten years. Microsoft, Amazon, Alphabet and Meta together traded at about 2 times the S&P 500’s price for each dollar of operating profit in 2017 and 2018. A rebound took the figure back to about 1.7 in 2023. So far this year it averages about 1.2. It touched 1.07 at the end of June and was 1.25 on 9 October. [18] On reported net income they are already below the market, because gains on private stakes inflate Alphabet’s and Amazon’s profits. Their return on capital fell too, from about 35 cents on the dollar to about 23. [18] I do not think the market has priced the case where spending does not slow.
Racing to Destroy Their Own Scarcity
A luxury brand protects its pricing power by artificially capping production. The AI industry is heading for a trillion dollars a year of spending to destroy its own scarcity as fast as humanly possible, selling a product whose price per unit is falling fast. Part 1 set out the risk that the price falls faster than use grows.
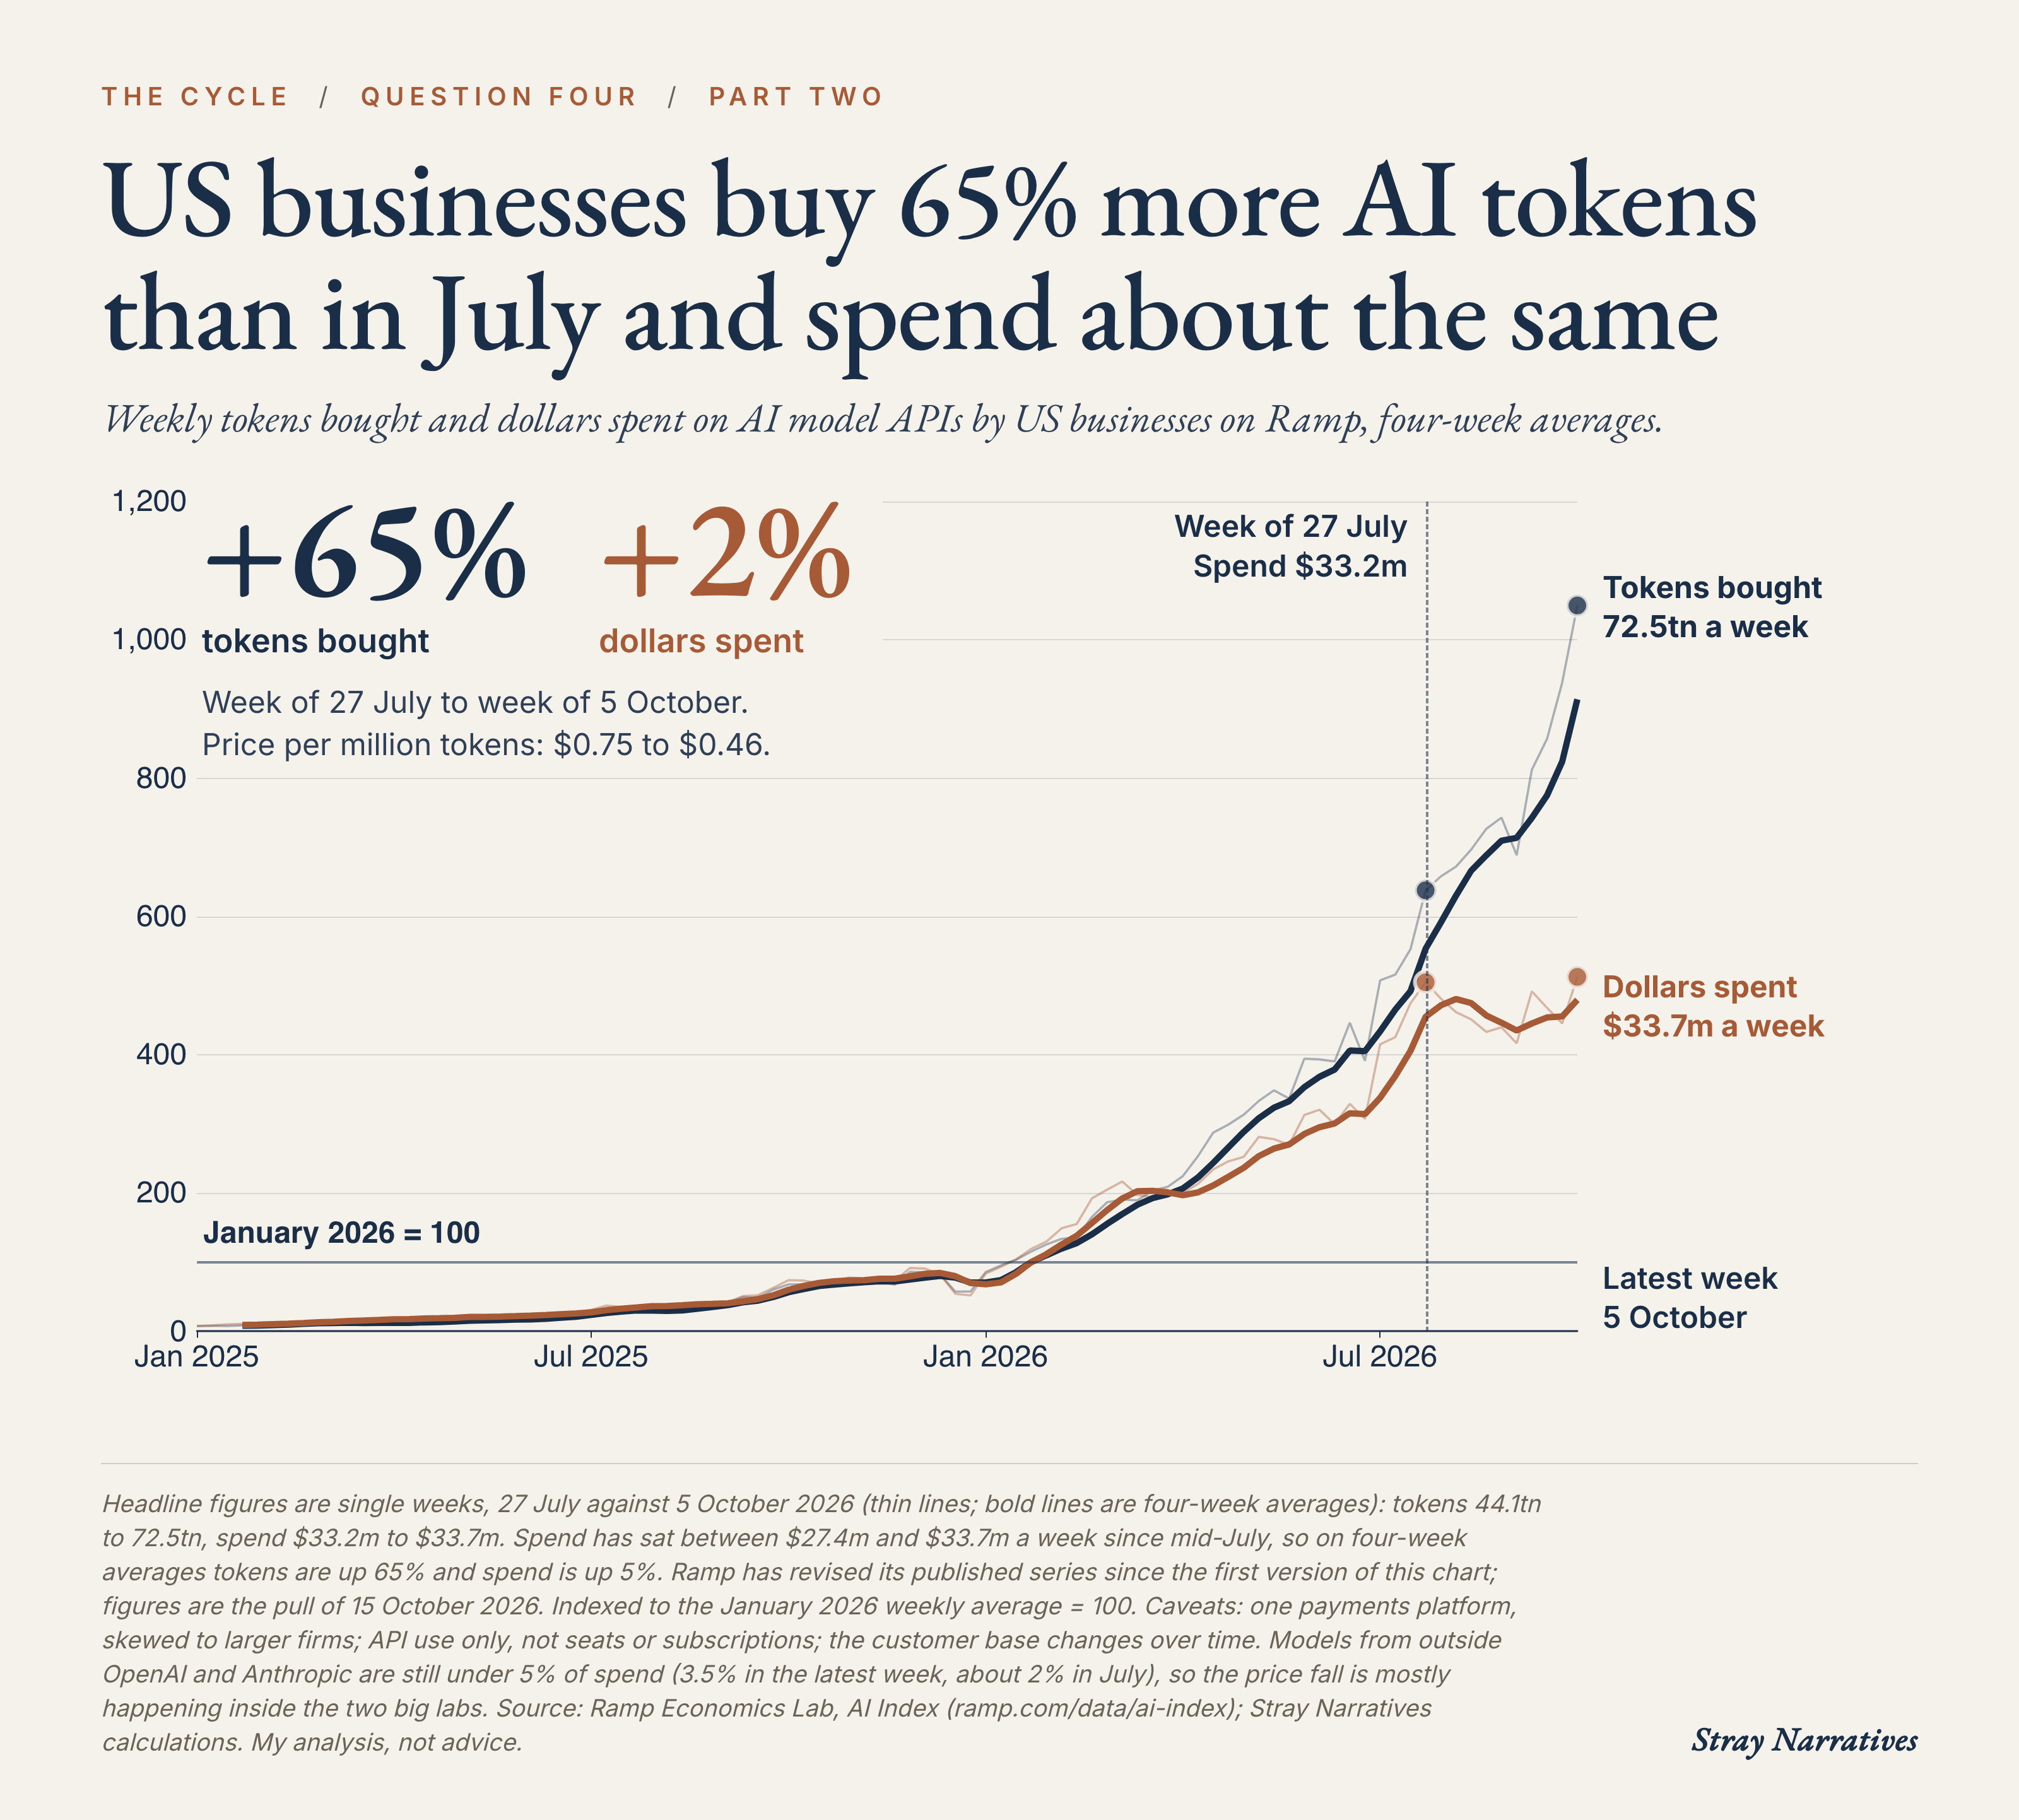
The cleanest evidence is Ramp, a payments platform that publishes weekly token volumes and spending for the businesses that use its AI token-spend tool. From the last week of July to the first week of October, those businesses bought about 65% more tokens and spent about 2% more. On four-week averages, tokens are up about 65% and dollars are up about 5%. The average price paid per million tokens fell from $0.75 to $0.46, partly because buyers moved to cheaper models and partly because the same models got cheaper. [19] The price fell as fast as use rose, so spending did not. This does not yet show across the market. The two big labs’ own annualised revenue kept rising through the summer, on press-reported figures, and Ramp sees token spend only for the businesses that use its tool, so it cannot see seat licences or contracts billed outside it. [20]
Efficiency is the enemy of the landlord. Many everyday queries do not need the best model. Hazy Research tested small models running on a laptop-class chip. On a set of single-turn chat and reasoning questions, the best of them matched or beat the reference answer 71% of the time in 2025, up from 23% in 2023. [21] Routing software now sends each request to the cheapest model able to handle it. AT&T’s routing cut the cost of coding and some other tasks by as much as 56% for a 2% drop in quality, as reported. [22] China makes the point harder. Its labs give away models only a few months behind the best. [3]
Two prices matter here. The price of a model’s answer is falling. The price of machine time is firmer, because chips and power are short: H100 rents at neocloud and marketplace providers slid through 2025 and have partly recovered in 2026, to about $2.83 an hour in October on Silicon Data’s index. Hyperscaler list rents for the same chip have kept falling. [23] The labs sit between the two. They rent scarce machine time and sell answers at falling prices.
A build-out of this size is financed on the assumption that machine time stays scarce and expensive. Efficiency is the enemy of the people who built the machines. If models keep doing more with less, the world needs fewer machines, and more of the machines already built will have to be rented out for whatever the market will pay.
The Fiber vs. The Routers
In the aftermath of the telecom crash, the physical infrastructure survived and some of its owners did not. Traffic on the internet kept growing, though far slower than forecast. Global Crossing wrote off $17.2 billion of assets in 2001, citing among other things overcapacity in the telecommunications market. Its shareholders were wiped out, but the network itself kept running under new owners. [24]
Fiber lasted because glass does not age. Its owners did not last: Global Crossing filed for bankruptcy in January 2002, less than two years after the telecom index peaked in March 2000. [24] [3]
The routers—the boxes moving the traffic—did not last as long. Level 3, one of the biggest builders, wrote off its operating equipment over three to seven years and its fiber over seven to twenty-five. [24] Capacity that arrives years ahead of its demand does not sit patiently on a shelf. The customers bought much less. Cisco’s router sales fell almost a third in two years. Its overall gross margin was higher in 2003 than in 2000, so this was not a margin squeeze, and its filings put the fall down to carriers spending less. Its share price still took a quarter-century to regain its peak. A supplier’s profit follows the spending, not the moat. [12]
This current build-out splits along the exact same fault line. The land, the grid connections, and the concrete shells are this cycle’s fiber. On most owners’ own schedules they last decades. They keep their value only if demand keeps pace, because efficiency cuts the power and buildings needed per unit of AI as it cuts the chips. The GPUs are this cycle’s routers, and rented compute hours are this cycle’s circuits. Capacity prices are what collapsed last time. The GPUs are where most of the capital has been spent, and I do not expect a financial payoff inside a warehouse of five-year-old chips.
The most likely ending is not a spectacular failure of artificial intelligence. The technology will succeed. The capacity will fill up—years after the payment schedules required it to. Prices will be set by an industry drowning in overcapacity. The machines will get used but a large part of the capital will be lost.
The Physical Speed Limit
Money is the first brake on this build. The physical world is the second, and it is already pressing.
Announced capacity is not delivered capacity. Eaton notes that while announced US data center projects have reached 307 gigawatts, only about a fifth will convert in the near term. [25] The rest is mostly slated for 2028 or later. [25] In Texas, data centers that came online between 2022 and 2024 drew, at their peak, an average of 49.8% of the power they had requested. [25]
As you look further out, the bottlenecks shift. Through 2027, the chip makers say packaging and memory are the constraint, and Micron expects memory to stay short through 2028. From 2028 the evidence points to power and electrical equipment as well. A large gas turbine ordered today ships in 2030 or 2031 and is running on site in 2032 or 2033, by GE Vernova’s own account. [26] Money can buy its way through these limits, but slowly.
This physical speed limit matters for three reasons:
It slows the break. Capital that cannot be deployed sits in construction and inventory. This is why I expect a bust that builds in stages, not a sudden crash.
It shifts the rent. While memory and turbines remain scarce, their manufacturers capture the margin. The AI labs are trapped in the middle, renting scarce machine time to sell tokens at falling prices.
It moves the dates. In the contracts I can read, billing starts when the capacity is delivered and accepted. A late campus delays the invoice. In the one data-center compute contract I have read in full, a long enough delay by the supplier lets the customer walk away, while delays from chip shortages or force majeure only move the date. [27]
When these physical limits finally clear, a massive wave of capacity will hit the market within the same few years, after prices have been falling. A speed limit merely postpones the reckoning; it does not cancel it.
The Sequence of the Bust
The mainframe era provides the blueprint for who loses first. In the 1960s, independent lessors bought IBM machines and rented them out, most of them amortizing the hardware over ten years while IBM used six. [28] When IBM announced a new generation of machines, by IBM’s own account in court the ten-year schedules proved too long. Five of the lessors wrote off more than $200 million between them from 1970 to 1974. [28] IBM’s own grip broke more than a decade later.
Today’s lessors are the owners of the machines who rent them out: the smaller cloud operators like CoreWeave, who amortize their servers over six years, and the lenders and vehicles behind them. [29] The labs are their tenants. In the 1960s IBM’s own customers could hand machines back on 30 days’ notice, so IBM carried the volume risk. The independent lessors leased on one- and two-year terms. [28] The labs have signed longer commitments than either, so the risk moves to whether they can keep paying. If GPUs age faster than that schedule, the owners inherit the 1970s lessor problem, and the tenants’ payments are what has to carry it. The labs are squeezed first, between scarce hardware and falling prices. The owners who rent to them are hit through the labs. The platform with lock-in breaks last.
I expect the stress to cascade through five distinct tests. The dates are the earliest ones. The speed limit can push them out:
The Listings: Both OpenAI and Anthropic have reportedly filed confidentially to go public, and OpenAI’s chief executive has said it will not list in 2026. [30] A listing replaces private belief with public quarterly testing. A strong listing is the bulls’ best outcome: it raises money, and a satisfactory credit rating would end Nvidia’s guarantee. It would count against me. A listing that is delayed, withdrawn or priced below the last private round would count for me.
The Step-Ups: Watch the private funding rounds. The moment a leading lab raises capital at a flat valuation, or grants heavy downside protection to secure the cash, the private ladder has stopped climbing. Flat means a priced round at or below the previous valuation. A smaller step-up than the last round is the earlier warning. A bigger round at a higher step-up counts against me.
The First Amendment: Customers have placed roughly $2.4 trillion in orders with four cloud companies, a total that covers all of their business and not only AI. [31] It is also the strongest demand evidence in the market, with a catch. Amazon’s backlog rose from $364 billion to $496 billion in one quarter, and in the same quarter Anthropic, one of the two weakest buyers, announced a commitment of more than $100 billion over ten years. [31] The filing does not say how much of the rise that is. How much of the whole belongs to the two big labs is the open question. At some point one large compute contract will be publicly rescheduled. One public amendment would signal the vulnerability of the rest. An exit because a supplier was late tells me about the supplier, not about demand, so it does not count. A customer cutting or delaying its own commitment does.
The 2027 Revenue Test: Compute contracts start billing when the capacity is delivered. I cannot see the labs’ contracts and I assume they are take-or-pay. If so, deals signed in 2025 and 2026 start to produce fixed monthly invoices from 2026 to 2028, with 2027 my central case. If the contracts are rigid, the labs’ cash reserves will be drained rapidly. If the first heavy invoices are paid on schedule through 2028, I am wrong.
The 2028 Hardware Test: Equipment makers (Nvidia, Broadcom) are paid by the clouds, not the labs, so a lab’s default does not touch a sale. It does touch the guarantees they have written: Nvidia’s starts with the first leases in 2028, and Broadcom has a backstop of its own. [9] What costs them most is the hyperscalers deciding they don’t need the next batch of machines.
Columbia Business School’s Shivaram Rajgopal ran a severe, 24-month scenario on eight companies exposed to this spending. It assumes cloud customers use 20% less compute and pay 15% less, equipment orders fall 35% with a 10% price drop, and investors pay 30% to 45% lower multiples for what is left. On those assumptions the eight lose $11.3 trillion, more than half their combined market value. It is a scenario, not a forecast. [32]
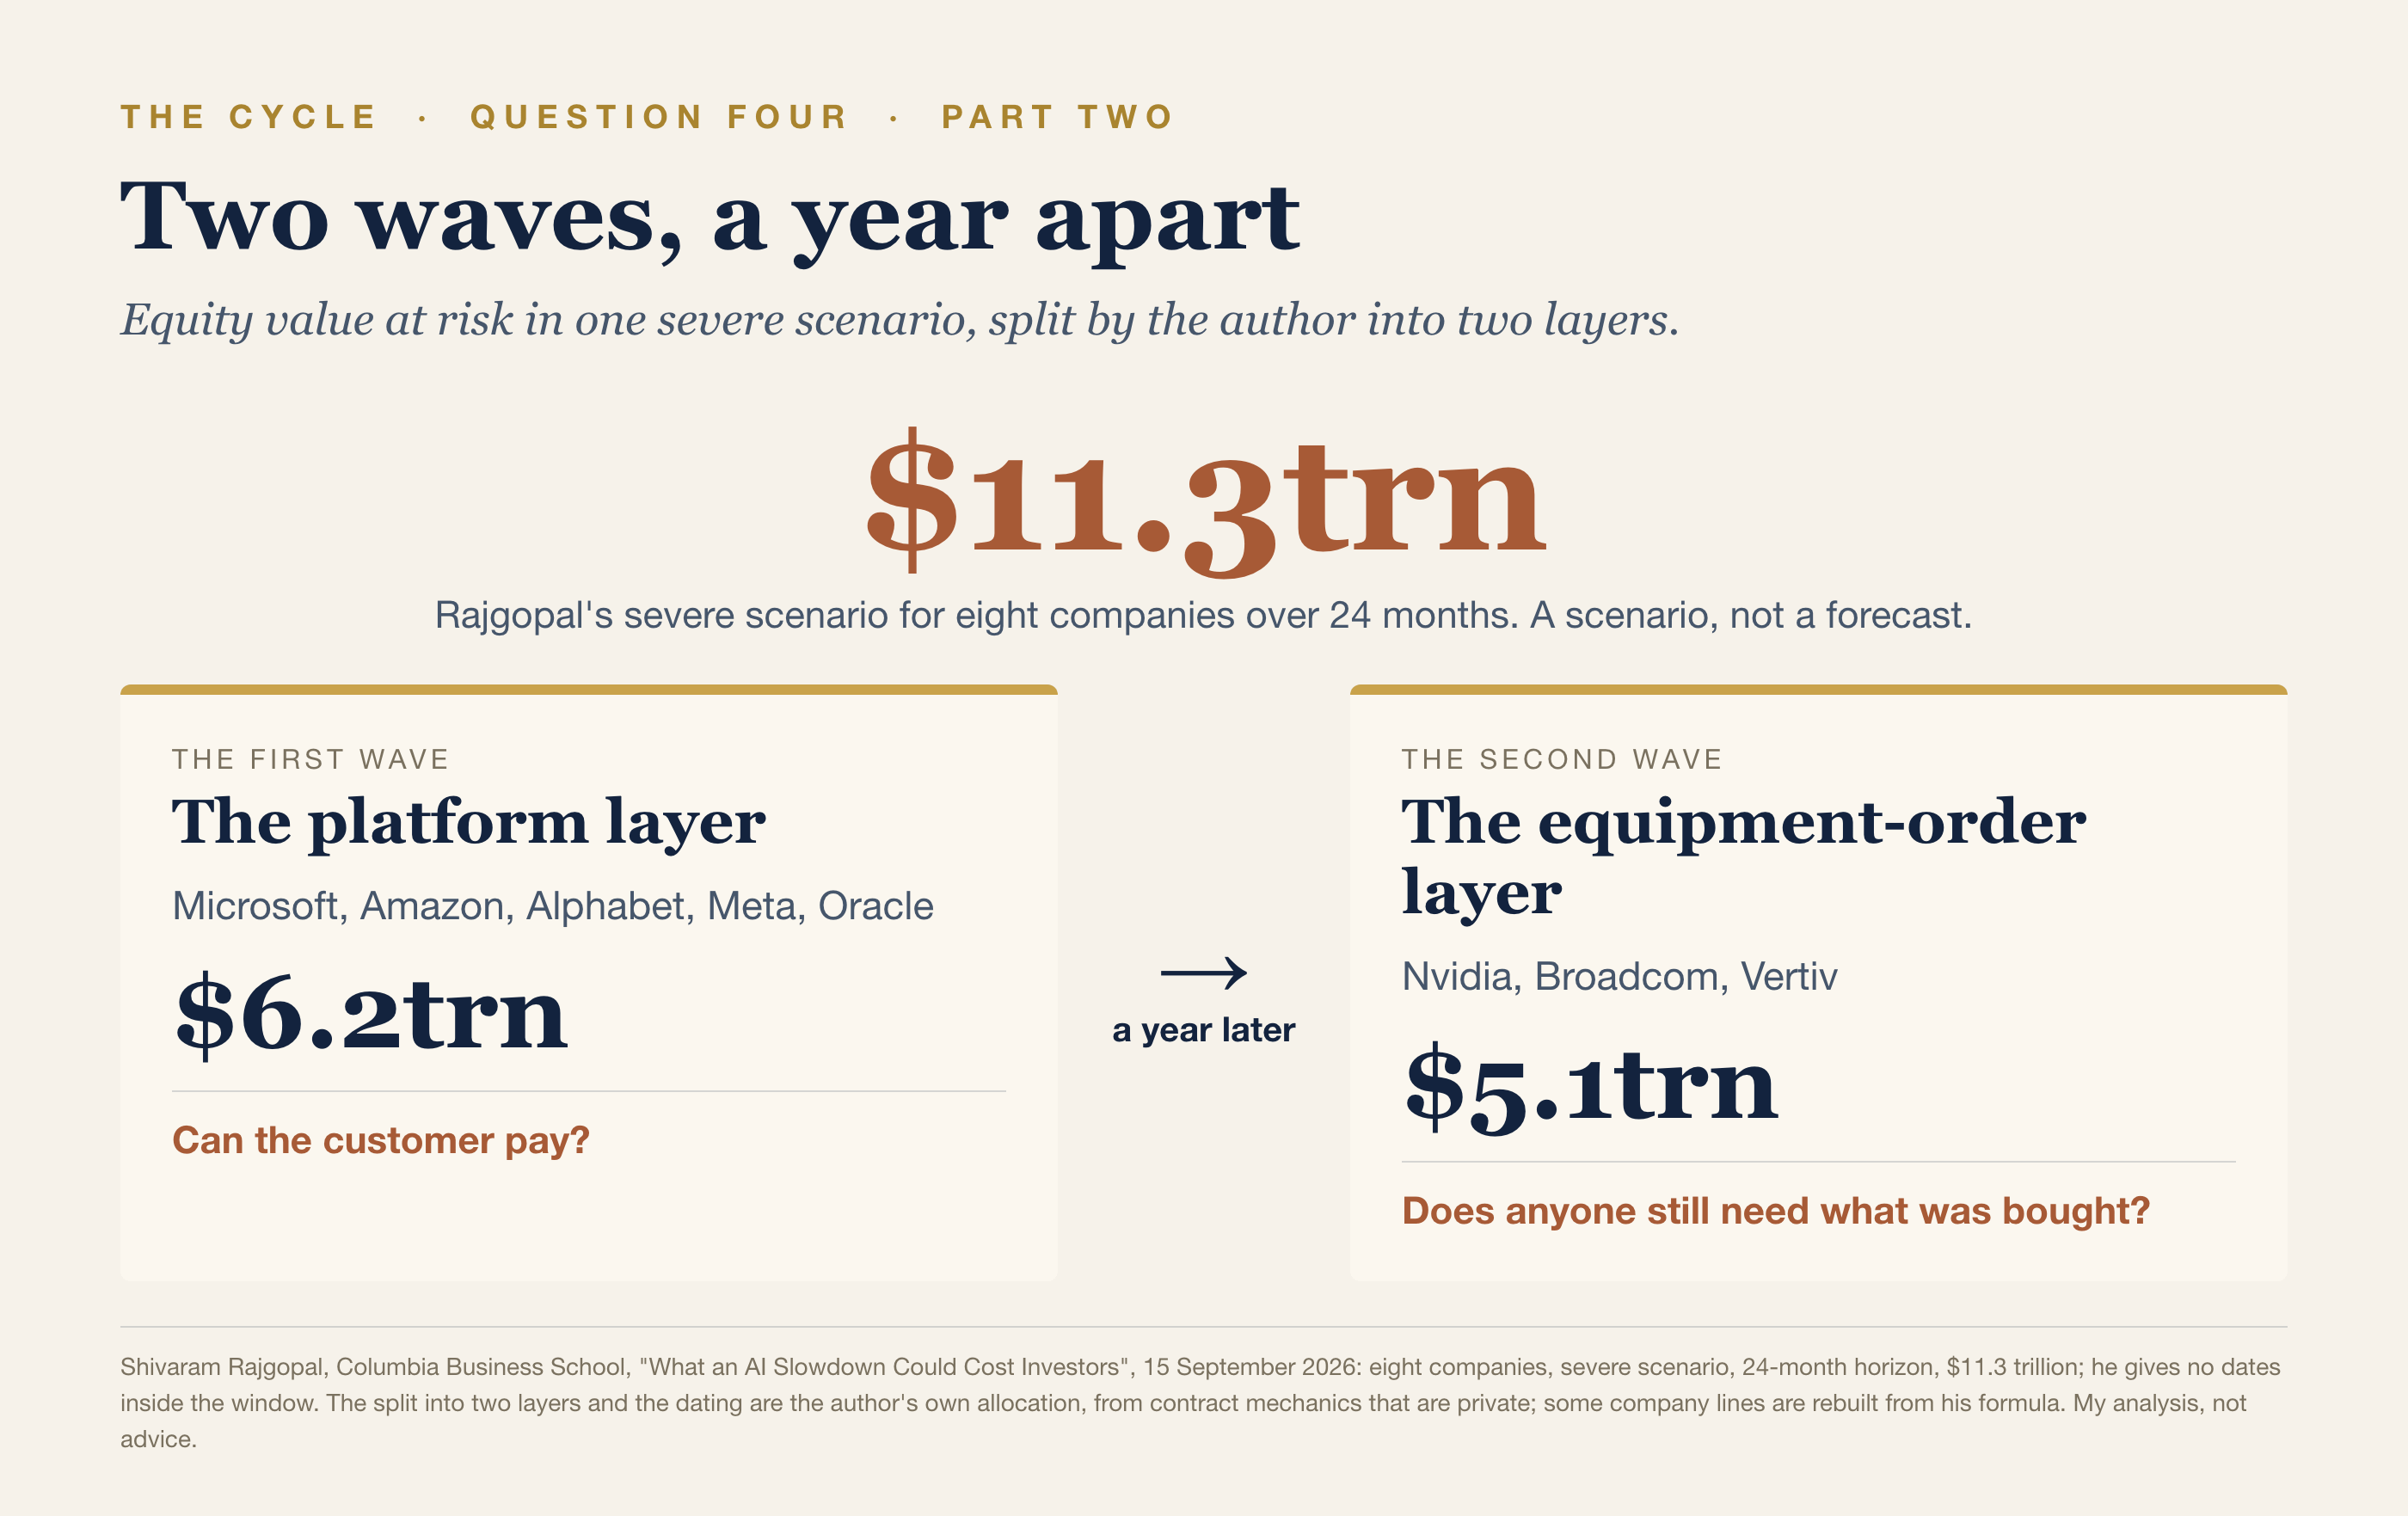
Cisco’s sales to service providers broke in the winter of 2000 to 2001, about a year after the telecom index peaked in March 2000. [12] [3] The test is which shows first. This is the order in which the evidence arrives, not the order in which share prices move. Prices move on expectations, and a funding scare or one big order cut could hit the equipment makers first.
My Forecast and What Would Prove It Wrong
Stocks go sideways for now, peak before the spending does, and then fall quite hard. The build has another year or two to run, because compute is still short. [23] [26] Stocks peaked first in 2000: the technology index topped in March [33] and the equipment makers’ sales broke a year later. [12] If the build peaks in 2028, stocks peak in 2027 and we have a bear market.
This is more than a sector correction. Seven companies in the build are about 30% of the S&P 500. [3] In 2000 technology fell about 51% while the rest rose about 6%, and the rest fell about 10% in 2001. [33] This time the rest falls with it, because the wealth is larger. US households hold about $74 trillion of equities, against $13.7 trillion in 2000: 227% of GDP against about 137%. [39] The top half of earners carries spending, and the bottom half is already squeezed. The response will be weaker than in 2001, with inflation above target since early 2021 and a federal deficit near 6% of GDP. [40]
The bubble is in earnings more than in multiples. Corporate profits after tax are 11.9% of GDP, the highest since 1947, against 10.1% in 2019. [35] At the 2019 share, profits would be about 15% lower on the same economy. Supplier margins are high because supply is short, and they fall as supply arrives. But because the bubble is in earnings, unlike 1999, I expect a lengthy bear market that will be the ultimate pain trade for an entire generation that has learned to “buy the dip”.
I will continue to monitor memory prices first, because the shortage is tightest there. [26] Then token prices: Ramp’s weekly business data shows volume up 65% since July while spending is flat, because the price paid per token has fallen by more than a third. [19] Then the five tests in this piece, and credit spreads, which the forty-year piece named as the first sign of the scare. [36] Long yields are high because the build absorbs savings. They will ease when the spending turns, and that is where I would add long duration Treasuries.
What would prove me wrong or extends the cycle?
Revenue arrives. If AI-funded advertising, government contracts or faster cloud growth show up as large disclosed revenue, the arithmetic softens. Part 1 sized the need at $420 billion to $560 billion of extra annual revenue for every $1 trillion of building. Azure, AWS and Google Cloud accelerated from 39%, 24% and 48% growth to 43%, 37% and 82% between the December 2025 and June 2026 quarters, the last including its own chips. [37] That pace cannot last as long as the bill needs. Look at the cloud companies’ quarterly revenue breakdowns and published government awards.
Chips last longer. Seven-year server lives instead of five cut the yearly cost by about 18%. [3] That softens the call and does not end it. Look in annual reports.
Margins hold. Profits after tax averaging above 11% of GDP through 2028 (11.4% on the last four quarters) would make today’s earnings the norm. The Bureau of Economic Analysis publishes the series every quarter. [35]
Hardware cracks first. If Nvidia cuts its sales forecast before the cloud backlogs shrink or the labs run short of cash, my order is backwards.
The Collision of Fear and Imagination
Paul Kedrosky says the largest financial bubbles of the past two hundred years tended to share a few things: loose credit, a great technology story, and sometimes a real estate component and a policy angle. His claim is that this is the first to sit at the intersection of all of them. [38]
I read the ingredients in this cycle as follows. The loose credit is lenders underwriting the rent on these leases as a spread over Treasuries, and the vendors’ own guarantees. The technology is a genuine exponential. The real estate is the land, power, and data centers. The policy is the tax code, which now lets companies deduct the full cost of qualifying equipment in the year they buy it. [38]
When the history of this cycle is written, the villain won’t be fraud, nor will it be a failure of the technology itself. It will be recorded as a collision between the two oldest forces in markets.
At the top, fear. An oligopoly of the world’s most profitable companies—businesses that spent a decade buying back stock because they had nothing left to build—suddenly reversed course. They became convinced that this new platform would decide their survival. And nothing on earth is less price-sensitive than a company fighting for its life.
Underneath, imagination. Humans do not possess an intuitive grasp of exponential math. When a real exponential curve appears, the market eventually stops doing the arithmetic and simply chooses to believe.
Fear signed the contracts. Imagination priced them. And the economy, which feels neither, will deliver the revenue at its own speed.
References
Figures are from company filings and announcements, court records and published studies, except where a reference marks them as press-reported. The $250 billion revenue ceiling is Aswath Damodaran’s. The room-to-borrow arithmetic, the valuation series and the 2027 and 2028 split of the stress test are my own.
[1] Aswath Damodaran, “AI’s Bar Mitzvah Moment: From Hype & Hope to Business Questions!”, Musings on Markets, 20 August 2026 (updated 21 August): current AI revenue “caps out at about $250 billion” on the most upbeat estimates.
[2] Moody’s Ratings hyperscaler capital-expenditure forecast, press-reported (CNBC and DataCenterDynamics, 24 July 2026; Moody’s report not independently obtained): Microsoft, Amazon, Meta, Alphabet, Oracle and CoreWeave, $785 billion in 2026 and close to $1 trillion in 2027.
[3] Stray Narratives, Issue 33 (Part 1): reference 22 (independent tally of annualised AI revenue, global excluding China: $175 billion in June 2026 after four quarters of growth of 35% or more); reference 20 (cost of revenue as a share of revenue: Datadog 20%, Salesforce 22%, ServiceNow 22%, Snowflake 33%); reference 14 (Epoch AI: seven-year server lives against five cut the yearly cost by about 18%); reference 7 (State Street SPDR S&P 500 ETF holdings, 29 September 2026: seven companies about 30%); references 5 and 28 (Epoch AI on the falling price of a given level of performance; open-weight models about three months behind the frontier on average (Epoch AI, October 2025); the DeepSeek, Qwen and Kimi models are published free of charge (model cards, as in reference 28)); reference 8 (Couper, Hejkal and Wolman, Federal Reserve Bank of Richmond Economic Quarterly, Fall 2003: the Nasdaq telecom index peaked on 10 March 2000).
[4] Free cash flow (operating cash flow less purchases of property and equipment), Microsoft, Amazon, Alphabet and Meta, from EODHD quarterly data tied to the companies’ Forms 10-Q and 10-K: about $60 billion in each of the third and fourth quarters of 2025, $21 billion in the first quarter of 2026, $6.7 billion in the second. Operating cash flow covered 104% of the four companies’ capital expenditure in the June quarter of 2026 and about 150% in 2025 (EODHD cash-flow statements; author’s calculation).
[5] Counterpoint Global (Michael Mauboussin and Dan Callahan), Morgan Stanley Investment Management, “To Free or Not to Free (Cash Flow),” 17 September 2026 (FactSet consensus at 31 August 2026, as reported; the forecasts cannot be re-derived): trailing free cash flow of Amazon, Alphabet, Microsoft, Meta and Oracle bottoms near -$265 billion in the third quarter of 2027 and recovers to nearly $505 billion by 2030, all after stock-based compensation; consensus operating profit of Nvidia keeps rising to 2030 and of Micron to 2029.
[6] Gross bond and note issuance from 1 January 2025 to 9 October 2026, from each company’s Forms 8-K, prospectus supplements and 10-Q debt notes: Alphabet about $114 billion, Amazon about $113 billion, Meta $55 billion, total $282 billion (Microsoft issued none). Leases signed but not yet commenced, undiscounted, at 30 June 2026 (Forms 10-Q; Microsoft Form 10-K): Alphabet $91.0 billion, Amazon $137.2 billion, Meta $279.0 billion, Microsoft $329.1 billion, total $836.3 billion.
[7] Author’s calculation, not a forecast. Room: additional debt that would bring the four companies to 70% debt-to-equity, 7 times operating income to interest, or 20% to 25% debt-to-assets, which a subscription research firm gives as medians for BBB and BB rated large companies (comfort levels, not limits; the four are rated far above BBB). From nothing to about $1 trillion depending on the test and whether leases count. Months until new borrowing at 25% to 40% of capital spending uses the room: April 2027 to November 2030. Central case ($500 billion of room, one third of spending borrowed, company guidance): March 2028.
[8] Alphabet Inc., Form 8-K filed 4 June 2026 ($84.75 billion announced, of which $44.75 billion placed and a $40 billion at-the-market programme, mainly to meet tax obligations on employee equity awards; none sold by 30 June); Form 10-Q, quarter ended 30 June 2026.
[9] NVIDIA Corporation, Form 8-K filed 17 August 2026 (Item 1.01, residual value guaranties on leases for which an affiliate of OpenAI is tenant: payment obligation cumulatively capped at $105 billion; effective on lease commencement, ready-for-service expected beginning in 2028 and the first phase in Nvidia’s fiscal 2029; OpenAI has agreed to reimburse); Form 10-Q, quarter ended 26 July 2026 (six-month Data Center revenue $164.3 billion; operating income, whole company, $117.3 billion). Broadcom Inc., Form 10-Q, quarter ended 2 August 2026 (Financial Guarantee: backstop of a customer’s lease obligations, maximum potential liability about $29 billion).
[10] Amazon.com, Inc., Forms 10-Q, quarters ended 31 March and 30 June 2026 (Note 2, OpenAI and Anthropic).
[11] OpenAI, “OpenAI raises $122 billion to accelerate the next phase of AI,” 31 March 2026 ($852 billion post-money valuation; figures as reported, the company page was not retrievable; Amazon’s Form 10-Q for June 2026, Note 2, corroborates the structure). Anthropic, “Series H,” anthropic.com/news/series-h, 28 May 2026: $65 billion raised at $965 billion post-money, against $380 billion at the previous round; run-rate revenue above $47 billion.
[12] Cisco Systems, Forms 10-K for fiscal 2000 to 2003 (July year-ends): net income $2.67 billion in 2000, net loss $1.01 billion in 2001, excess-inventory charge $2.25 billion; router net sales down 31.5% from fiscal 2001 to 2003. Share price, EODHD (CSCO.US, split-adjusted): closing high 27 March 2000, first close above it 10 December 2025. Total company gross margin 64.4% in fiscal 2000 and 70.1% in fiscal 2003 (no router-level margin is disclosed). Form 10-Q for the quarter ended 28 April 2001: sales to service providers “were adversely affected during the second and third quarters of fiscal 2001”.
[13] Consumer subscription revenue, each on its latest full year or run rate: Netflix, revenue, fiscal 2025 (Q4 2025 shareholder letter); Amazon, subscription services net sales, 2025 (Form 10-K); Disney, Entertainment direct-to-consumer revenue, fiscal 2025 (Q4 release, 13 November 2025); Spotify, Premium revenue, first half of 2026 doubled (Form 6-K); Microsoft, Microsoft 365 Consumer, fiscal 2026 (Form 10-K); ChatGPT consumer, at most 60% of OpenAI’s $2 billion a month run rate (OpenAI, 31 March 2026; author’s estimate). Total about $162 billion.
[14] Sundar Pichai, Alphabet Q2 2024 earnings call, 23 July 2024: “the risk of under-investing is dramatically greater than the risk of over-investing for us here” (transcript as published by The Motley Fool). Mark Zuckerberg, Access podcast, 18 September 2025, press-reported (Business Insider): “I actually think the risk is higher on the other side”.
[15] Pew Research Center, “Google users are less likely to click on links when an AI summary appears in the results,” 22 July 2025 (900 US adults, March 2025; 8% of visits to a results page with an AI summary included a click on a traditional result, 15% without).
[16] Alphabet Inc., Form 10-Q, quarter ended 30 June 2026 (“Google Search & other” revenue $63,271 million against $54,190 million, up 16.8%); Meta Platforms, Inc., Form 10-Q, quarter ended 30 June 2026 (advertising revenue $59,363 million against $46,563 million, up 27.5%).
[17] Timothy Bresnahan and Shane Greenstein, “The Competitive Crash in Large-Scale Commercial Computing,” NBER Working Paper 4901, October 1994, pp. 15 to 19 and 44 to 45: share of mainframe sites with a persistent increase in installed processing power (MIPS) over a three-year window, 1984-86 against 1989-91, fell from 33% to 25%; “About one fourth of total expected mainframe demand has gone away”; the decline “is not actual switches to client/server”.
[18] Stray Narratives calculations on EODHD prices and company filings: summed market value over summed operating income of Microsoft, Amazon, Alphabet and Meta, divided by the same ratio for S&P 500 members at each month end. Averages 2.03 (2017), 2.08 (2018), 1.70 (2023), 1.17 (2026 to 9 October); 1.07 on 30 June 2026 and 1.25 on 9 October. On GAAP net income 1.49 (2023) and 0.86 (9 October 2026), because of gains on private stakes. Return on capital about 35 cents (2023) and about 23 cents (twelve months to June 2026).
[19] Ramp Economics Lab, AI Index (ramp.com/data/ai-index), pulled 15 October 2026: weekly token volume and spend of a sample of Ramp businesses that use its Token Spend Management product (not representative of Ramp’s total AI spend, per Ramp; the sample changes over time and earlier weeks have been restated). Week of 27 July 2026 $33.2 million and 44.1 trillion tokens; week of 5 October $33.7 million and 72.5 trillion tokens (spend +1.5%, tokens +65%; four-week averages tokens +65%, spend +5%); blended price per million tokens about $0.75 to $0.46 (-38%).
[20] Lab run rates, press-reported. Anthropic: above $47 billion in May 2026 (company-stated, Series H announcement) and above $65 billion at the end of July (company statement to investors, 17 August 2026, via Bloomberg). OpenAI: about $2 billion a month in March (company announcement, as reported); above $40 billion by mid-August (Bloomberg, 13 August 2026; Aswath Damodaran, 20 August, citing OpenAI’s own estimate).
[21] Jon Saad-Falcon et al. (Hazy Research), arXiv 2511.07885 (v7, 1 October 2026): share of 1 million single-turn chat and reasoning queries on which the best local model matched or beat frontier models (win/tie rate, partly judged by an LLM), 23% in 2023 (Mixtral-8x7B) and 71% in 2025 (GPT-OSS-120B on an Apple M4 Max). Multi-turn, agentic and long-context work is excluded.
[22] The Information, “AT&T is Using Open Source Models to Curb Anthropic Bills,” August 2026 (paywalled; figures as attributed in PYMNTS, 20 August 2026). Press-reported.
[23] Silicon Data, SDH100RT H100 rental index (daily, neocloud tier), silicondata.com: $2.83 per GPU-hour on 11 October 2026. Marketplace median $2.58 in the second half of 2024 and $1.95 in the second half of 2025; hyperscaler median $9.34 in the second half of 2024 and $6.26 in the second half of 2025, with hyperscaler rates falling in every region since the first quarter of 2025 (“H100 Rental Prices by Region,” 31 July 2026).
[24] Global Crossing Ltd., Form 10-K for fiscal 2002, filed 8 December 2003 (the company filed no 10-K for fiscal 2001): asset impairment charges of $17.181 billion in 2001, of which $8.573 billion goodwill and intangibles; holders of common and preferred shares receive nothing under the plan. FCC Order DA 03-3121, 8 October 2003. Level 3 Communications, Form 10-K for 2001: operating equipment 3 to 7 years, network infrastructure including fiber 7 to 25 years. Traffic growth: Couper, Hejkal and Wolman, Federal Reserve Bank of Richmond Economic Quarterly, Fall 2003, as in Issue 33 reference 8. Chapter 11 petitions filed 28 January 2002; the impairment is attributed in the filing, among other things, to overcapacity in the telecommunications market.
[25] Eaton Corporation plc, Q2 2026 earnings call, 31 July 2026 (307 GW is a tracked pipeline of announced and planned projects; “only roughly 20%” converts near term; the majority 2028 and beyond). North American Electric Reliability Corporation, 2025 Long-Term Reliability Assessment (January 2026), ERCOT: data centres energised 2022 to 2024 reached 49.8% of requested megawatts at peak.
[26] TSMC, Q2 2026 earnings call, 16 July 2026 (packaging capacity “so tight that now it limits my customers’ growth”); Micron, fiscal fourth-quarter 2026 prepared remarks, 30 September 2026 (memory supply “constrained” through 2027 and 2028); GE Vernova, Q2 2026 webcast, 22 July 2026 (gas turbines “mostly sold out through ’30”; chief executive: heavy-duty units “shipped in ’30, ’31 ... commissioned in ’32 and ’33 at site”).
[27] IREN Limited, Partner Statement of Work with Microsoft, 2 November 2025 (Exhibit 10.3, Form 10-Q filed 5 February 2026): firm minimum commitment, with a termination right and refund on late delivery by the supplier; delays from force majeure (including industry-wide shortages) or a failure by Nvidia to deliver chips extend the date and do not open the termination right. CoreWeave, Forms 10-Q for 2025: OpenAI may terminate on “repeated failure to meet availability of service requirements”; the sentence appears in the 2025 filings and not in later ones. Order forms are not filed.
[28] Greyhound Computer Corp. v. International Business Machines Corp., 559 F.2d 488 (9th Cir. 1977): Greyhound depreciated IBM equipment at 10% a year, IBM over six years. United States v. IBM (S.D.N.Y.), Defendant’s Exhibit 14971, “Historical Narrative,” 1980, an advocacy document prepared for IBM’s defence: lessors’ ten-year schedules too long once System/370 arrived; five lessors wrote off more than $200 million, 1970 to 1974 (the total is the author’s sum). Telex Corp. v. IBM, 510 F.2d 894 (10th Cir. 1975): IBM’s rental customers could return equipment on 30 days’ notice, while competing lessors’ equipment was generally leased for terms of one, two or more years.
[29] Depreciable lives of servers and network equipment, each company’s Form 10-K: Alphabet six years; Amazon five to six; Meta five to five and a half; Microsoft two to six; Oracle and CoreWeave six.
[30] Press-reported: Sam Altman, Fortune, 12 September 2026 (“not 2026”); OpenAI confidential draft registration, CNBC, 8 June 2026; Anthropic confidential draft registration, NPR, 1 June 2026; Anthropic timing, Fortune and TechCrunch, 28 to 29 September 2026. The registrations are non-public.
[31] Remaining performance obligations, total company and not AI-only: Microsoft Form 10-K (year ended 30 June 2026, Note 12; $684 billion); Oracle Form 10-Q (quarter ended 31 August 2026; $664 billion); Alphabet Form 10-Q (30 June 2026; $519.5 billion); Amazon Form 10-Q (30 June 2026; about $496 billion). Sum about $2.4 trillion (author’s sum). Amazon’s figure was about $364 billion at 31 March 2026 (Form 10-Q, first quarter). Amazon Form 10-Q (June 2026, Note 2): AWS and Anthropic expanded their commitment by more than $100 billion over 10 years in the quarter.
[32] Shivaram Rajgopal (Columbia Business School), “What an AI Slowdown Could Cost Investors,” 15 September 2026: eight-company severe scenario over 24 months, $11.3 trillion lost of about $19.8 trillion; scenario analysis, not a forecast; the loss includes assumed cuts of 30% to 45% to valuation multiples as well as the volume and price shocks in the text. The $6.2 trillion and $5.1 trillion split and its dating are the author’s allocation, not Rajgopal’s.
[33] S&P 500 Information Technology sector index and S&P 500 price index (EODHD SPLRCT.INDX, GSPC.INDX), 24 March to 29 December 2000: technology about -51%, S&P 500 about -14%. The rest of the index is the author’s calculation, chain-linking the two series with technology at about 34% of the index in March 2000 (about +6%, a range of +5% to +8% for weights of 33% to 36%); 2001: about -10%.
[34] EODHD, IBM.US adjusted close: peak 15 January 1970 to low 13 August 1970 (about -41%); peak 13 February 1973 to low 13 September 1974 (about -57%; on price alone about -42% and -58%). IBM Archives, “IBM Highlights, 1970-1984” (net earnings $934 million in 1969, $1.01 billion in 1970, $1.27 billion in 1972, $1.83 billion in 1974). S&P 500 price index (EODHD GSPC.INDX): 91.68 to 74.76 (-18.5%) over the 1970 window and 116.78 to 65.20 (-44.2%) over the 1973-74 window. Jeremy J. Siegel, “Valuing Growth Stocks: Revisiting the Nifty Fifty,” AAII Journal, October 1998 (price-earnings ratio of 35 in the early 1970s; “worth only 17.1 times earnings” on the following 26 years).
[35] US Bureau of Economic Analysis via FRED, all US corporations including financials, corporate profits after tax with inventory valuation and capital consumption adjustments (CPATAX) divided by nominal GDP, vintage of 30 September 2026: 11.9% in the second quarter of 2026 (previous high 11.4%, second quarter of 2021); average 6.9% for 1947 to 2019, 10.1% for 2019 and 10.0% for 2010 to 2019; 11.4% on the four quarters to the second quarter of 2026. Profits at the 2019 share would be about 15% lower than at 11.9% (10.1 divided by 11.9; author’s calculation).
[36] Stray Narratives, Issue 26, “The 40-Year Tide is Turning (And the First Move Might Fool Most),” 7 August 2026 (the deflationary scare as the decoy; what ends a long bull; sequence over date).
[37] Cloud revenue growth year over year, December 2025 and June 2026 quarters: Microsoft Azure +39% (earnings release, 28 January 2026) and +43% (29 July 2026); Amazon AWS +24% (earnings release, 5 February 2026) and +37% (Form 10-Q, June 2026); Google Cloud +48% (earnings release, 4 February 2026) and +82% (Form 10-Q, June 2026; includes sales of Google’s AI chip systems from the second quarter of 2026). Total cloud revenue, not AI-only.
[38] Paul Kedrosky, The Meb Faber Show, episode 648, 28 August 2026: bubbles “tend to have a bunch of things in common”, “maybe loose credit”, a great technology story, “sometimes a real estate component” and “sometimes a policy angle”; “this moment is the first one that sits at the intersection of all of the forces that created the largest bubbles in US history”. One Big Beautiful Bill Act (2025), section 70301: permanent 100% bonus depreciation for property acquired after 19 January 2025. The mapping to this cycle is the author’s.
[39] Board of Governors of the Federal Reserve System, Financial Accounts of the United States (Z.1), households and nonprofit organizations, directly and indirectly held corporate equities, market value (via FRED, series BOGZ1LM153064475Q, release of 11 September 2026): $74.0 trillion at the end of the second quarter of 2026 and $13.7 trillion at the end of the first quarter of 2000. Ratio to nominal GDP (BEA via FRED, GDP): 227% and 137% (author’s calculation). Indirect holdings include mutual funds, pension and insurance assets.
[40] US Bureau of Economic Analysis via FRED, vintage of 30 September 2026: PCE price index (PCEPI) and PCE excluding food and energy (PCEPILFE), year over year, never at or below 2.0% in any month from March 2021 to August 2026 (3.4% and 3.0% in August 2026). Federal deficit: FRED FYFSGDA188S, federal surplus or deficit as a percent of GDP, fiscal 2025, -5.8%; BEA federal receipts less expenditures over GDP (FGRECPT, FGEXPND, GDP), -5.2% in the second quarter of 2026 (author’s calculation).
The 'spare cash is nearly gone' point stood out to me, since operating cash covering only about 104% of capex makes the earnings-bubble framing hard to dismiss. Do you think the $836 billion of uncommenced leases or the bond issuance shows stress first when the funding dries up?